Answered step by step
Verified Expert Solution
Question
1 Approved Answer
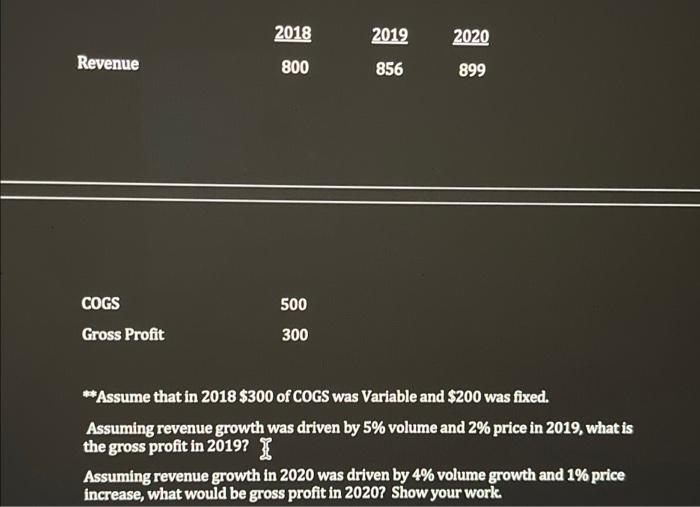
please use graph and show work 2018 800 500 2020 Revenue 899 COGS Gross Profit 300 **Assume that in 2018 $300 of COGS was Variable
please use graph and show work 
2018 800 500 2020 Revenue 899 COGS Gross Profit 300 **Assume that in 2018 $300 of COGS was Variable and $200 was fixed. Assuming revenue growth was driven by 5% volume and 2% price in 2019, what is the gross profit in 2019? Assuming revenue growth in 2020 was driven by 4% volume growth and 1% price increase, what would be gross profit in 2020? Show your work. 2019 856 
Step by Step Solution
There are 3 Steps involved in it
Step: 1

Get Instant Access to Expert-Tailored Solutions
See step-by-step solutions with expert insights and AI powered tools for academic success
Step: 2

Step: 3

Ace Your Homework with AI
Get the answers you need in no time with our AI-driven, step-by-step assistance
Get Started


