Answered step by step
Verified Expert Solution
Link Copied!

Question

1 Approved Answer

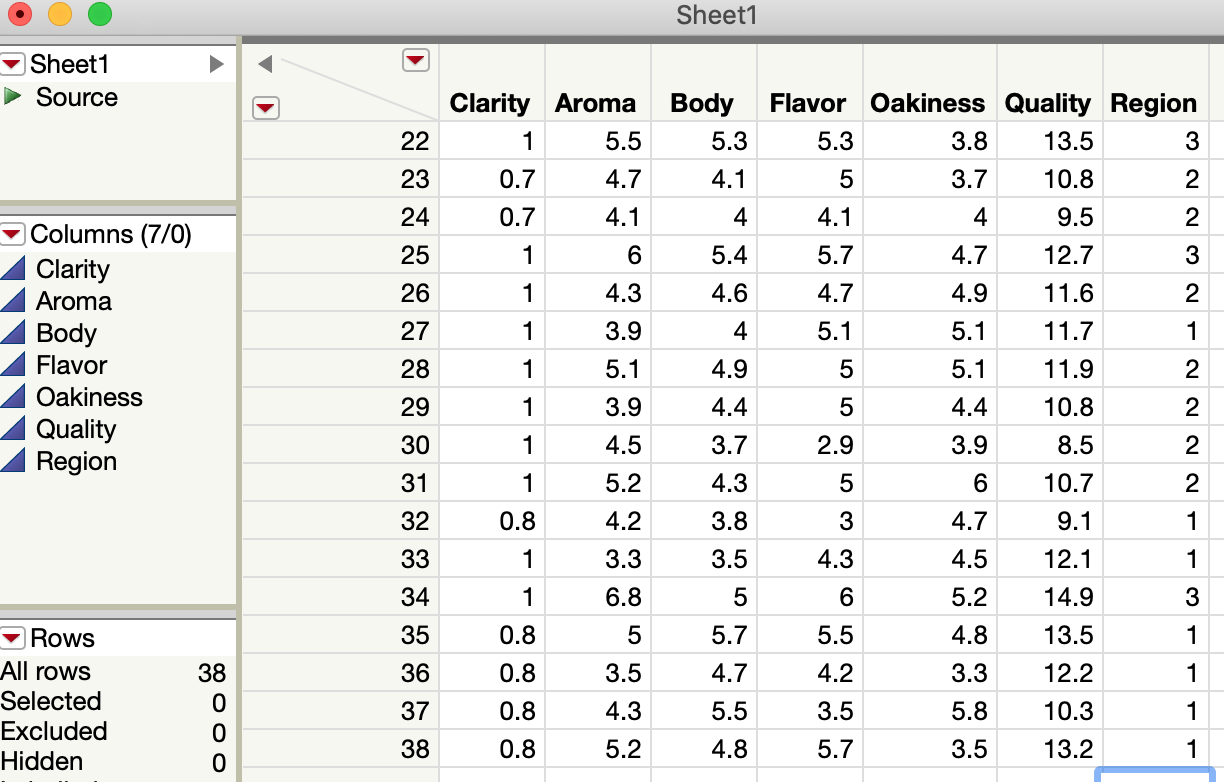
PLEASE USE JMP Clarity Aroma Body Flavor Oakiness Quality Region 1 3.3 2.8 3.1 4.1 9.8 1 1 4.4 4.9 3.5 3.9 12.6 1 1

PLEASE USE JMP

Clarity Aroma Body Flavor Oakiness Quality Region

1 3.3 2.8 3.1 4.1 9.8 1

1 4.4 4.9 3.5 3.9 12.6 1

1 3.9 5.3 4.8 4.7 11.9 1

1 3.9 2.6 3.1 3.6 11.1 1

1 5.6 5.1 5.5 5.1 13.3 1

1 4.6 4.7 5 4.1 12.8 1

1 4.8 4.8 4.8 3.3 12.8 1

1 5.3 4.5 4.3 5.2 12 1

1 4.3 4.3 3.9 2.9 13.6 3

1 4.3 3.9 4.7 3.9 13.9 1

1 5.1 4.3 4.5 3.6 14.4 3

0.5 3.3 5.4 4.3 3.6 12.3 2

0.8 5.9 5.7 7 4.1 16.1 3

0.7 7.7 6.6 6.7 3.7 16.1 3

1 7.1 4.4 5.8 4.1 15.5 3

0.9 5.5 5.6 5.6 4.4 15.5 3

1 6.3 5.4 4.8 4.6 13.8 3

1 5 5.5 5.5 4.1 13.8 3

1 4.6 4.1 4.3 3.1 11.3 1

0.9 3.4 5 3.4 3.4 7.9 2

0.9 6.4 5.4 6.6 4.8 15.1 3

1 5.5 5.3 5.3 3.8 13.5 3

0.7 4.7 4.1 5 3.7 10.8 2

0.7 4.1 4 4.1 4 9.5 2

1 6 5.4 5.7 4.7 12.7 3

1 4.3 4.6 4.7 4.9 11.6 2

1 3.9 4 5.1 5.1 11.7 1

1 5.1 4.9 5 5.1 11.9 2

1 3.9 4.4 5 4.4 10.8 2

1 4.5 3.7 2.9 3.9 8.5 2

1 5.2 4.3 5 6 10.7 2

0.8 4.2 3.8 3 4.7 9.1 1

1 3.3 3.5 4.3 4.5 12.1 1

1 6.8 5 6 5.2 14.9 3

0.8 5 5.7 5.5 4.8 13.5 1

0.8 3.5 4.7 4.2 3.3 12.2 1

0.8 4.3 5.5 3.5 5.8 10.3 1

0.8 5.2 4.8 5.7 3.5 13.2 1
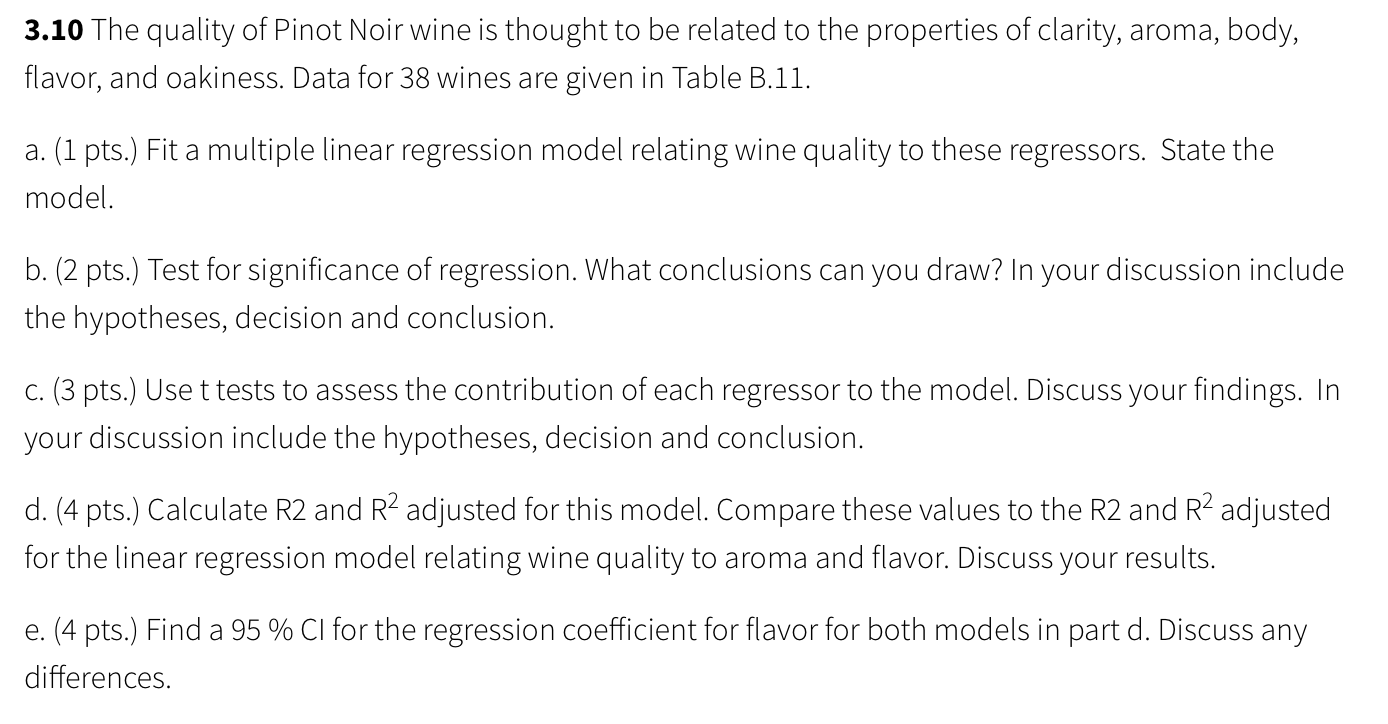
image text in transcribedimage text in transcribed
3.10 The quality of Pinot Noir wine is thought to be related to the properties of clarity, aroma, body, flavor, and oakiness. Data for 38 wines are given in Table 8.11. a. (1 pts.) Fit a multiple linear regression model relating wine quality to these regressors. State the model. b. (2 pts.) Test for significance of regression. What conclusions can you draw? In your discussion include the hypotheses, decision and conclusion. c. (3 pts.) Usettests to assess the contribution of each regressorto the model. Discuss yourfindings. In your discussion include the hypotheses, decision and conclusion. d. (4 pts.) Calculate R2 and R2 adjusted for this model. Compare these values to the R2 and R2 adjusted for the linear regression model relating wine quality to aroma and flavor. Discuss your results. e. (4 pts.) Find a 95 0/0 CI for the regression coefficient for flavor for both models in part d. Discuss any differences. CO. E] Sheet1 D Source EColumns (7/0) A Clarity A Aroma A Body A Flavor A Oakiness A Quality A Region 2] Flows All rows 3 Selected Excluded Hidden 00003 22 23 24 25 26 27 28 29 30 31 32 33 34 35 36 37 38 1 0.7 0.7 1 5.5 4.7 4.1 6 4.3 3.9 5.1 3.9 4.5 5.2 4.2 3.3 6.8 5 3.5 4.3 5.2 Sheet1 5.3 4.1 4 5.4 4.6 4 4.9 4.4 3.7 4.3 3.8 3.5 5 5.7 4.7 5.5 4.8 5.3 5 4.1 5.7 4.7 5.1 5 5 2.9 5 3 4.3 6 5.5 4.2 3.5 5.7 3.8 3.7 4 4.7 4.9 5.1 5.1 4.4 3.9 6 4.7 4.5 5.2 4.8 3.3 5.8 3.5 13.5 10.8 9.5 12.7 11.6 11.7 11.9 10.8 8.5 10.7 9.1 12.1 14.9 13.5 12.2 10.3 13.2 Clarity Aroma Body Flavor Oakiness Quality Region -|-l-l-|-CD-|-lNMMN-LMODMMOD

Step by Step Solution

There are 3 Steps involved in it

Step: 1

blur-text-image

Get Instant Access to Expert-Tailored Solutions

See step-by-step solutions with expert insights and AI powered tools for academic success

Step: 2

blur-text-image

Step: 3

blur-text-image

Ace Your Homework with AI

Get the answers you need in no time with our AI-driven, step-by-step assistance

Get Started

Recommended Textbook for

Business Analytics Data Analysis and Decision Making

Authors: S. Christian Albright, Wayne L. Winston

5th edition

1133629601, 9781285965529 , 978-1133629603

More Books

Students also viewed these Mathematics questions

Question

Provide Annotated Bibliography - Case 16.1 of Hospital Supply Inc.

Answered: 1 week ago

Question

=+1. What are my goals related to succession?

Answered: 1 week ago