Answered step by step
Verified Expert Solution
Question
1 Approved Answer
please use matlab (1) The mechanical behavior of a tissue is modeled by a Maxwell body. The tissues undergo sinusoidal deformation with strain profile ((t))
please use matlab
(1) The mechanical behavior of a tissue is modeled by a Maxwell body. The tissues undergo sinusoidal deformation with strain profile ((t)) given as: (t) = elot The mechanical properties of the tissue are as follows: p= 5 Pas, and E= 1 kPa. (a) Plot the amplitude of the transfer function (complex modulus) as a function of frequency (w) from zero up to 100,000 radians/s. Please use a logarithmic axis for w when presenting your plot. Be sure to briefly describe the frequency-dependent behavior of the amplitude (25 points). (20 points for plot, 5 points for discussion). (b) Plot the phase of the transfer function (complex modulus) (in radians) as a function of frequency (w) from zero up to 100,000 radians/s. Please use a logarithmic axis for a when presenting your plot. Be sure to briefly describe the frequency-dependent behavior of the phase (25 points). (20 points for plot, 5 points for discussion). All plots must be computer-generated, and properly labeled. Be sure include a copy of your computer code in your submission. (1) The mechanical behavior of a tissue is modeled by a Maxwell body. The tissues undergo sinusoidal deformation with strain profile ((t)) given as: (t) = elot The mechanical properties of the tissue are as follows: p= 5 Pas, and E= 1 kPa. (a) Plot the amplitude of the transfer function (complex modulus) as a function of frequency (w) from zero up to 100,000 radians/s. Please use a logarithmic axis for w when presenting your plot. Be sure to briefly describe the frequency-dependent behavior of the amplitude (25 points). (20 points for plot, 5 points for discussion). (b) Plot the phase of the transfer function (complex modulus) (in radians) as a function of frequency (w) from zero up to 100,000 radians/s. Please use a logarithmic axis for a when presenting your plot. Be sure to briefly describe the frequency-dependent behavior of the phase (25 points). (20 points for plot, 5 points for discussion). All plots must be computer-generated, and properly labeled. Be sure include a copy of your computer code in your submission
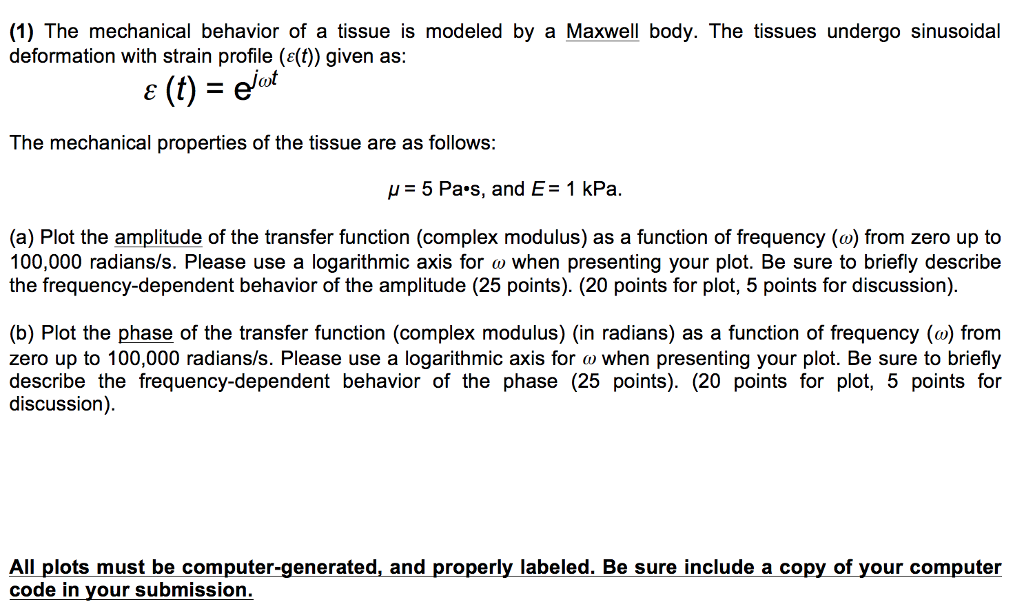
Step by Step Solution
There are 3 Steps involved in it
Step: 1
Get Instant Access to Expert-Tailored Solutions
See step-by-step solutions with expert insights and AI powered tools for academic success
Step: 2
Step: 3
Ace Your Homework with AI
Get the answers you need in no time with our AI-driven, step-by-step assistance
Get Started