Please use matlab and ID:1155123456


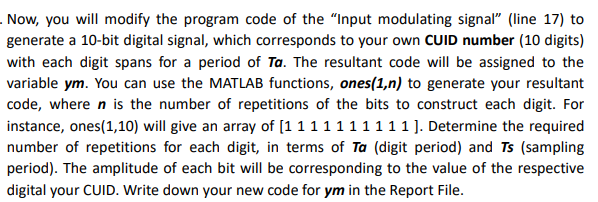
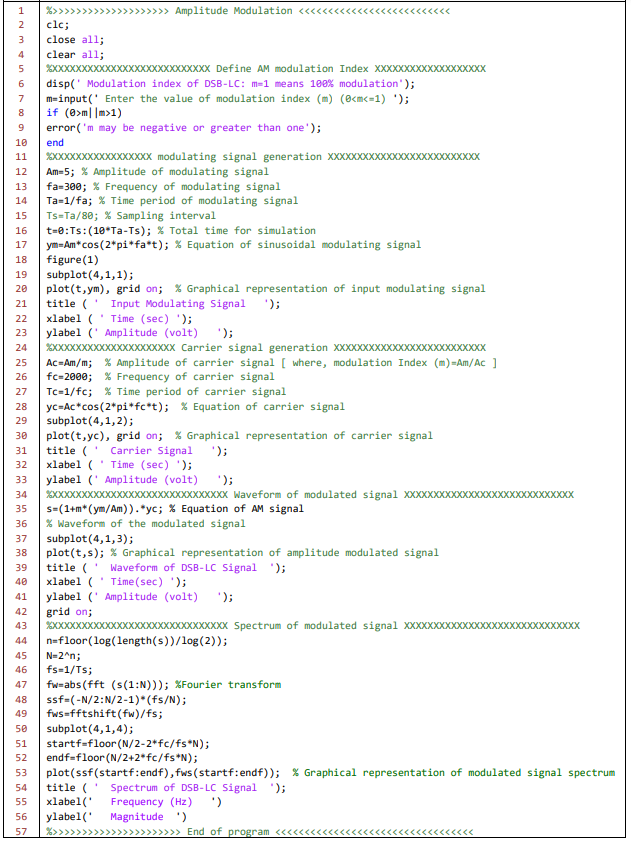
Now, you will modify the program code of the "Input modulating signal (line 17) to generate a 10-bit digital signal, which corresponds to your own CUID number (10 digits) with each digit spans for a period of Ta. The resultant code will be assigned to the variable ym. You can use the MATLAB functions, ones(1,n) to generate your resultant code, where n is the number of repetitions of the bits to construct each digit. For instance, ones(1,10) will give an array of [1 1 11111111 ). Determine the required number of repetitions for each digit, in terms of Ta (digit period) and Ts (sampling period). The amplitude of each bit will be corresponding to the value of the respective digital your CUID. Write down your new code for ym in the Report File. 1 2 3 4 5 res end 6 7 8 9 10 11 12 13 14 15 16 17 18 19 20 21 22 23 24 25 26 27 28 29 30 >>>>>>>>>>> Amplitude Modulation m|m>1) error('m may be negative or greater than one'); XXXXXXXXXXXXXXXXXX modulating signal generation XXXXXXXXXXXXXXXXXXXXXXXXXX Am=5; % Amplitude of modulating signal fa=300; % Frequency of modulating signal Ta-1/fa; % Time period of modulating signal Ts=Ta/80; % Sampling interval t=0:Ts:(10*Ta-Ts); % Total time for simulation ym-Am*cos(2*pi*fa*t); % Equation of sinusoidal modulating signal figure(1) subplot(4,1,1); plot(t,ym), grid on; % Graphical representation of input modulating signal title(' Input Modulating Signal '); xlabel ('Time (sec) '); ylabel (' Amplitude (volt) '); *XXXXXXXXXXXXXXXXXXXXX Carrier signal generation XXXXXXXXXXXXXXXXXXXXXXXXXX Ac=Am/m; % Amplitude of carrier signal ( where, modulation Index (m)-Am/Ac ] fc=2000; % Frequency of carrier signal Tc=1/fc; % Time period of carrier signal yC=Ac*cos(2*pi*fc*t); % Equation of carrier signal subplot(4,1,2); plot(t,yc), grid on; % Graphical representation of carrier signal title(' Carrier Signal '); xlabel (' Time (sec) '); ylabel (' Amplitude (volt) '); XXXXXXXXXXXXXXXXXXXXXXXXXXXXXXX Waveform of modulated signal XXXXXXX S=(1+m*(ym/Am)). yc; % Equation of AM signal % Waveform of the modulated signal subplot(4,1,3); plot(t,s); % Graphical representation of amplitude modulated signal title ('Waveform of DSB-LC Signal "); xlabel ('Time (sec) '); ylabel (' Amplitude (volt) '); grid on; XXXXXXXXXXXXXXXXXXXXXXXXXXXXXXX Spectrum of modulated signal XXXXXXX xxxxxxxxxxxx n=floor(log(length(s)/log(2)); N=2an; fs=1/Ts; fw=abs(fft (s(1:N))); XFourier transform ssf=(-N/2:N/2-1)*(fs/N); fws-fftshift(fw/fs; subplot(4,1, 4); startf-floor(N/2-2fc/fsN); endf-floor(N/2+2*fc/fs*N); plot(ssf(startf:endf), fws (startf:endf)); % Graphical representation of modulated signal spectrum title(' Spectrum of DSB-LC Signal '); xlabel(' Frequency (Hz) ) ylabel Magnitude') >>>>> End of program 31 32 33 34 35 36 37 38 39 40 41 42 43 44 45 46 47 48 49 51 52 53 54 55 56 57 Now, you will modify the program code of the "Input modulating signal (line 17) to generate a 10-bit digital signal, which corresponds to your own CUID number (10 digits) with each digit spans for a period of Ta. The resultant code will be assigned to the variable ym. You can use the MATLAB functions, ones(1,n) to generate your resultant code, where n is the number of repetitions of the bits to construct each digit. For instance, ones(1,10) will give an array of [1 1 11111111 ). Determine the required number of repetitions for each digit, in terms of Ta (digit period) and Ts (sampling period). The amplitude of each bit will be corresponding to the value of the respective digital your CUID. Write down your new code for ym in the Report File. 1 2 3 4 5 res end 6 7 8 9 10 11 12 13 14 15 16 17 18 19 20 21 22 23 24 25 26 27 28 29 30 >>>>>>>>>>> Amplitude Modulation m|m>1) error('m may be negative or greater than one'); XXXXXXXXXXXXXXXXXX modulating signal generation XXXXXXXXXXXXXXXXXXXXXXXXXX Am=5; % Amplitude of modulating signal fa=300; % Frequency of modulating signal Ta-1/fa; % Time period of modulating signal Ts=Ta/80; % Sampling interval t=0:Ts:(10*Ta-Ts); % Total time for simulation ym-Am*cos(2*pi*fa*t); % Equation of sinusoidal modulating signal figure(1) subplot(4,1,1); plot(t,ym), grid on; % Graphical representation of input modulating signal title(' Input Modulating Signal '); xlabel ('Time (sec) '); ylabel (' Amplitude (volt) '); *XXXXXXXXXXXXXXXXXXXXX Carrier signal generation XXXXXXXXXXXXXXXXXXXXXXXXXX Ac=Am/m; % Amplitude of carrier signal ( where, modulation Index (m)-Am/Ac ] fc=2000; % Frequency of carrier signal Tc=1/fc; % Time period of carrier signal yC=Ac*cos(2*pi*fc*t); % Equation of carrier signal subplot(4,1,2); plot(t,yc), grid on; % Graphical representation of carrier signal title(' Carrier Signal '); xlabel (' Time (sec) '); ylabel (' Amplitude (volt) '); XXXXXXXXXXXXXXXXXXXXXXXXXXXXXXX Waveform of modulated signal XXXXXXX S=(1+m*(ym/Am)). yc; % Equation of AM signal % Waveform of the modulated signal subplot(4,1,3); plot(t,s); % Graphical representation of amplitude modulated signal title ('Waveform of DSB-LC Signal "); xlabel ('Time (sec) '); ylabel (' Amplitude (volt) '); grid on; XXXXXXXXXXXXXXXXXXXXXXXXXXXXXXX Spectrum of modulated signal XXXXXXX xxxxxxxxxxxx n=floor(log(length(s)/log(2)); N=2an; fs=1/Ts; fw=abs(fft (s(1:N))); XFourier transform ssf=(-N/2:N/2-1)*(fs/N); fws-fftshift(fw/fs; subplot(4,1, 4); startf-floor(N/2-2fc/fsN); endf-floor(N/2+2*fc/fs*N); plot(ssf(startf:endf), fws (startf:endf)); % Graphical representation of modulated signal spectrum title(' Spectrum of DSB-LC Signal '); xlabel(' Frequency (Hz) ) ylabel Magnitude') >>>>> End of program 31 32 33 34 35 36 37 38 39 40 41 42 43 44 45 46 47 48 49 51 52 53 54 55 56 57


