Answered step by step
Verified Expert Solution
Question
1 Approved Answer
Problem 1: MATLAB contains functions to calculate the natural logarithm (log), the logarithm to the base 10 (log10), and the logarithm to the base


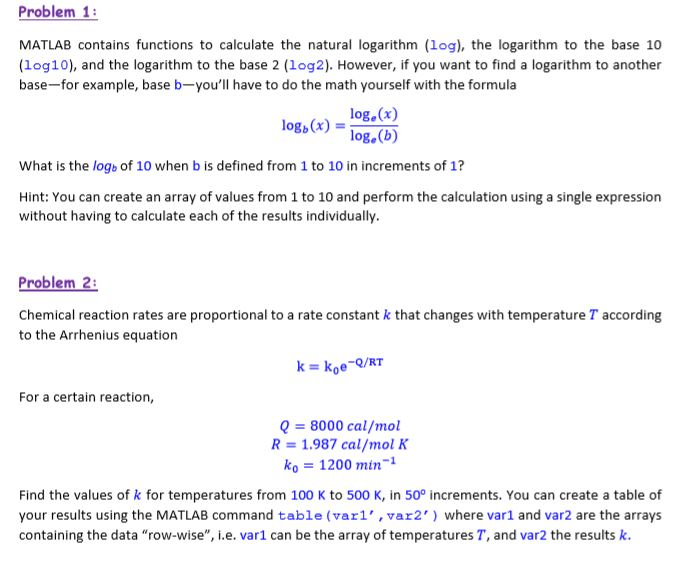
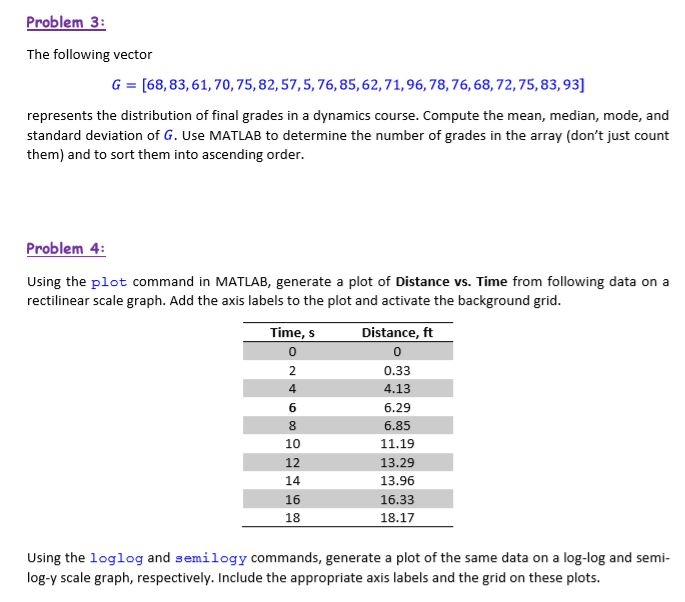
Problem 1: MATLAB contains functions to calculate the natural logarithm (log), the logarithm to the base 10 (log10), and the logarithm to the base 2 (log2). However, if you want to find a logarithm to another base-for example, base b-you'll have to do the math yourself with the formula log, (x) log. (b) What is the log of 10 when b is defined from 1 to 10 in increments of 1? Hint: You can create an array of values from 1 to 10 and perform the calculation using a single expression without having to calculate each of the results individually. log, (x) = Problem 2: Chemical reaction rates are proportional to a rate constant k that changes with temperature T according to the Arrhenius equation For a certain reaction, k = koe-Q/RT Q = 8000 cal/mol R = 1.987 cal/mol K ko = 1200 min- Find the values of k for temperatures from 100 K to 500 K, in 50 increments. You can create a table of your results using the MATLAB command table (varl', var2') where var1 and var2 are the arrays containing the data "row-wise", i.e. var1 can be the array of temperatures T, and var2 the results k. Problem 3: The following vector G = [68, 83, 61, 70, 75, 82, 57, 5, 76, 85, 62, 71, 96, 78, 76, 68, 72, 75, 83,93] represents the distribution of final grades in a dynamics course. Compute the mean, median, mode, and standard deviation of G. Use MATLAB to determine the number of grades in the array (don't just count them) and to sort them into ascending order. Problem 4: Using the plot command in MATLAB, generate a plot of Distance vs. Time from following data on a rectilinear scale graph. Add the axis labels to the plot and activate the background grid. Time, s ON 0 2 4 6 8 10 12 24 14 H 16 18 Distance, ft 0 0.33 4.13 6.29 6.85 11.19 13.29 13.96 16.33 18.17 Using the loglog and semilogy commands, generate a plot of the same data on a log-log and semi- log-y scale graph, respectively. Include the appropriate axis labels and the grid on these plots.
Step by Step Solution
★★★★★
3.50 Rating (157 Votes )
There are 3 Steps involved in it
Step: 1
Problem 1 Solution Problem 2 Solution Problem 3 Solut...
Get Instant Access to Expert-Tailored Solutions
See step-by-step solutions with expert insights and AI powered tools for academic success
Step: 2

Step: 3

Ace Your Homework with AI
Get the answers you need in no time with our AI-driven, step-by-step assistance
Get Started


