

Answered step by step
Verified Expert Solution
Question
1 Approved Answer
please use matlab LB 9Chpt below that will generate a SINGLE figure co of sin(x), cos(x), and tan(x) from -pi to pi, in 1 row
please use matlab
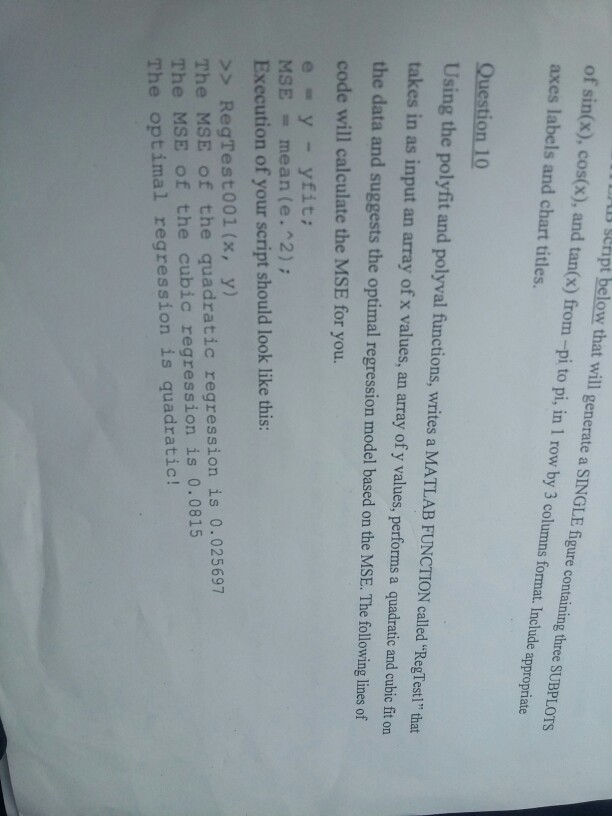
LB 9Chpt below that will generate a SINGLE figure co of sin(x), cos(x), and tan(x) from -pi to pi, in 1 row by 3 columns format. Include appropriate axes labels and chart titles. ntaining three SUBPLOTs Question 10 Using the polyfit and polyval functions, writes a MATLAB FUNCTION called "RegTest!" that takes in as input an array of x values, an array of y values, performs a quadratic and cubic fit on the data and suggests the optimal regression model based on the MSE. The following lines of code will calculate the MSE for you. e = y - yfit; MSE = mean (e. ^2) ; Execution of your script should look like this: >>RegTest001 (x, y) The MSE of the quadratic regression is 0.025697 The MSE of the cubic regression is 0.0815 The optimal regression is quadraticStep by Step Solution
There are 3 Steps involved in it
Step: 1

Get Instant Access to Expert-Tailored Solutions
See step-by-step solutions with expert insights and AI powered tools for academic success
Step: 2

Step: 3
Ace Your Homework with AI
Get the answers you need in no time with our AI-driven, step-by-step assistance
Get Started
Database Systems For Advanced Applications Dasfaa 2022 International Workshops Bdms Bdqm Gdma Iwbt Maqtds And Pmbd Virtual Event April 11 14 2022 Proceedings Lncs 13248
Authors: Uday Kiran Rage ,Vikram Goyal ,P. Krishna Reddy
1st Edition
3031112164, 978-3031112164