Please use MATLAB to solve following problem:
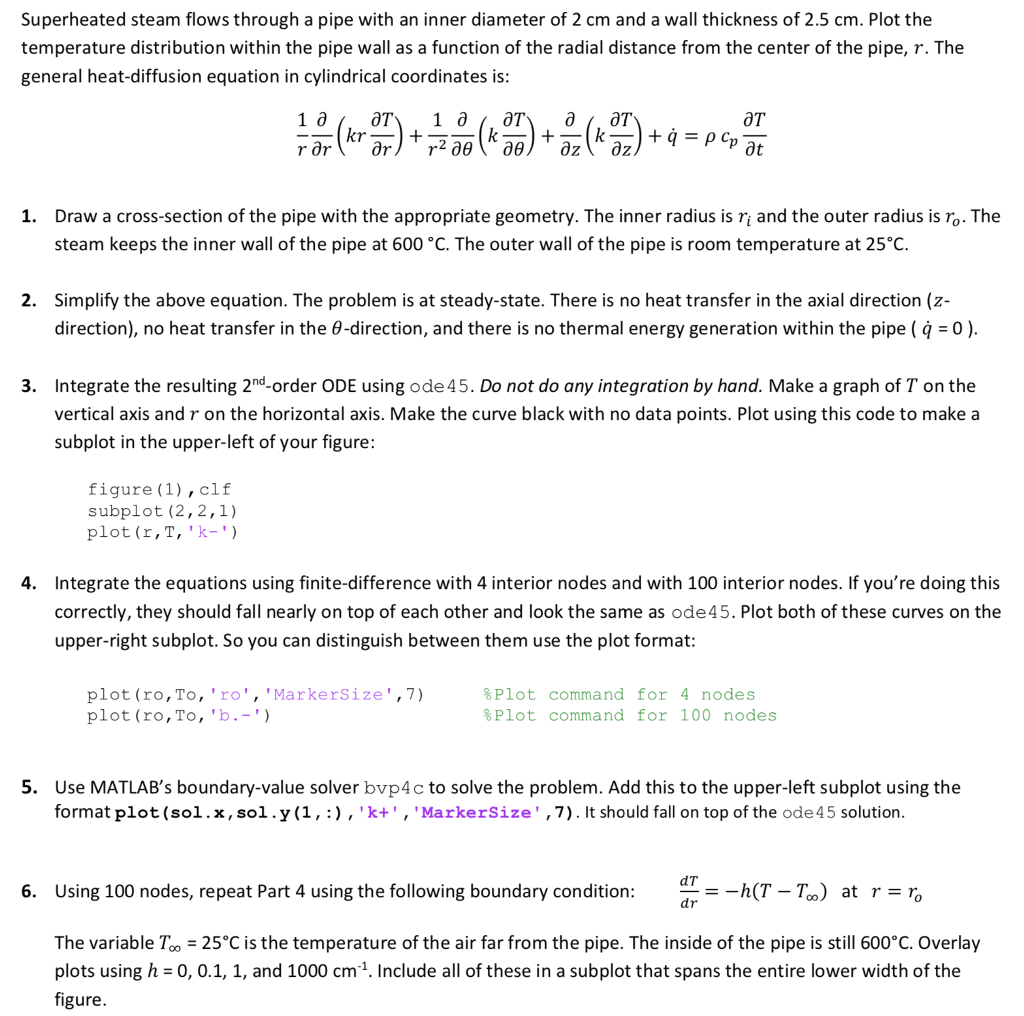
Superheated steam flows through a pipe with an inner diameter of 2 cm and a wall thickness of 2.5 cm. Plot the temperature distribution within the pipe wall as a function of the radial distance from the center of the pipe, r. The general heat-diffusion equation in cylindrical coordinates is ?? Draw a cross-section of the pipe with the appropriate geometry. The inner radius is ? and the outer radius is r?. The steam keeps the inner wall of the pipe at 600 C. The outer wall of the pipe is room temperature at 25C. 1. 2. Simplify the above equation. The problem is at steady-state. There is no heat transfer in the axial direction (z- direction), no heat transfer in the ?-direction, and there is no thermal energy generation within the pipe ( q = 0 ) Integrate the resulting 2nd-order ODE using ode 45. Do not do any integration by hand. Make a graph of T on the vertical axis and r on the horizontal axis. Make the curve black with no data points. Plot using this code to make a subplot in the upper-left of your figure: 3. figure (1), clif subplot (2,2,1) plot (r,T, 'k-' Integrate the equations using finite-difference with 4 interior nodes and with 100 interior nodes. If you're doing this correctly, they should fall nearly on top of each other and look the same as ode45. Plot both of these curves on the upper-right subplot. So you can distinguish between them use the plot format 4. plot (ro, To, 'ro,"MarkerSize',7) plot (ro, To, "b.-') %Plot command for 4 nodes %Plot command for 100 nodes 5. Use MATLAB's boundary-value solver bvp4c to solve the problem. Add this to the upper-left subplot using the format plot (sol.x,sol.y (1,:), 'k+', MarkerSize',7). It should fall on top of the ode45 solution dT 6. Using 100 nodes, repeat Part 4 using the following boundary condition: dr The variable To-25C is the temperature of the air far from the pipe. The inside of the pipe is still 600C Overlay plots using h-0, 0.1, 1, and 1000 cm-1. Include all of these in a subplot that spans the entire lower width of the figure Superheated steam flows through a pipe with an inner diameter of 2 cm and a wall thickness of 2.5 cm. Plot the temperature distribution within the pipe wall as a function of the radial distance from the center of the pipe, r. The general heat-diffusion equation in cylindrical coordinates is ?? Draw a cross-section of the pipe with the appropriate geometry. The inner radius is ? and the outer radius is r?. The steam keeps the inner wall of the pipe at 600 C. The outer wall of the pipe is room temperature at 25C. 1. 2. Simplify the above equation. The problem is at steady-state. There is no heat transfer in the axial direction (z- direction), no heat transfer in the ?-direction, and there is no thermal energy generation within the pipe ( q = 0 ) Integrate the resulting 2nd-order ODE using ode 45. Do not do any integration by hand. Make a graph of T on the vertical axis and r on the horizontal axis. Make the curve black with no data points. Plot using this code to make a subplot in the upper-left of your figure: 3. figure (1), clif subplot (2,2,1) plot (r,T, 'k-' Integrate the equations using finite-difference with 4 interior nodes and with 100 interior nodes. If you're doing this correctly, they should fall nearly on top of each other and look the same as ode45. Plot both of these curves on the upper-right subplot. So you can distinguish between them use the plot format 4. plot (ro, To, 'ro,"MarkerSize',7) plot (ro, To, "b.-') %Plot command for 4 nodes %Plot command for 100 nodes 5. Use MATLAB's boundary-value solver bvp4c to solve the problem. Add this to the upper-left subplot using the format plot (sol.x,sol.y (1,:), 'k+', MarkerSize',7). It should fall on top of the ode45 solution dT 6. Using 100 nodes, repeat Part 4 using the following boundary condition: dr The variable To-25C is the temperature of the air far from the pipe. The inside of the pipe is still 600C Overlay plots using h-0, 0.1, 1, and 1000 cm-1. Include all of these in a subplot that spans the entire lower width of the figure