Please use R Programming for the question in the attached image.
Here is the link to the data file for BankData.csv for question 1: https://drive.google.com/file/d/18kGNrHUfgcVv2hMKqL5E05L40xCl6e1M/view?usp=sharing
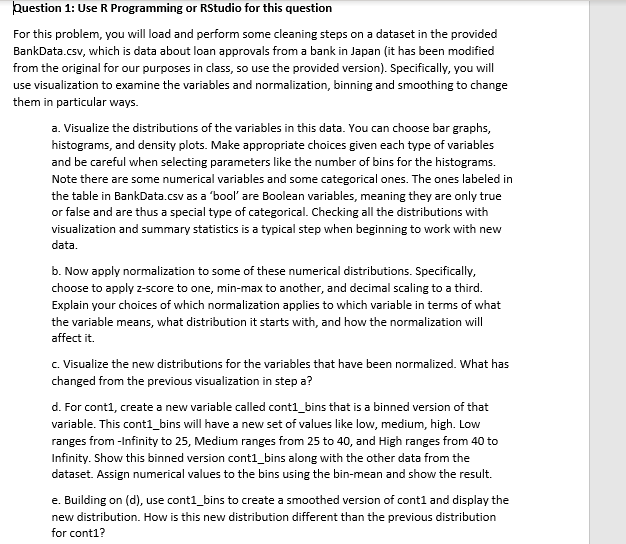
Question 1: Use R Programming or RStudio for this question For this problem, you will load and perform some cleaning steps on a dataset in the provided BankData.csv, which is data about loan approvals from a bank in Japan (it has been modified from the original for our purposes in class, so use the provided version). Specifically, you will use visualization to examine the variables and normalization, binning and smoothing to change them in particular ways. a. Visualize the distributions of the variables in this data. You can choose bar graphs, histograms, and density plots. Make appropriate choices given each type of variables and be careful when selecting parameters like the number of bins for the histograms. Note there are some numerical variables and some categorical ones. The ones labeled in the table in BankData.csv as a "bool' are Boolean variables, meaning they are only true or false and are thus a special type of categorical. Checking all the distributions with visualization and summary statistics is a typical step when beginning to work with new data. b. Now apply normalization to some of these numerical distributions. Specifically, choose to apply z-score to one, min-max to another, and decimal scaling to a third. Explain your choices of which normalization applies to which variable in terms of what the variable means, what distribution it starts with, and how the normalization will affect it. c. Visualize the new distributions for the variables that have been normalized. What has changed from the previous visualization in step a? d. For conti, create a new variable called cont1_bins that is a binned version of that variable. This cont1_bins will have a new set of values like low, medium, high. Low ranges from -Infinity to 25, Medium ranges from 25 to 40, and High ranges from 40 to Infinity. Show this binned version cont1_bins along with the other data from the dataset. Assign numerical values to the bins using the bin-mean and show the result. e. Building on (d), use cont1_bins to create a smoothed version of conti and display the new distribution. How is this new distribution different than the previous distribution for cont1