 Please use R to answer the question. Thank you!
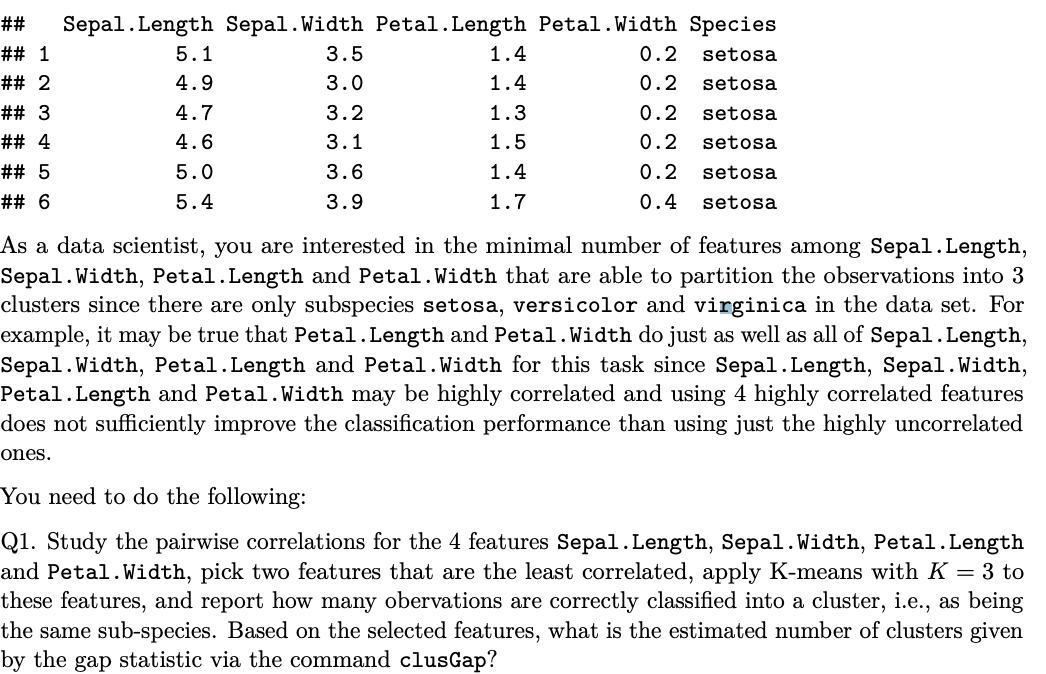
3.5 1.4 ## ## 1 ## 2 ## 3 ## 4 ## 5 ## 6 Sepal.Length Sepal.Width Petal.Length Petal.Width Species 5.1 0.2 setosa 4.9 3.0 1.4 0.2 setosa 4.7 3.2 1.3 0.2 setosa 3.1 1.5 0.2 setosa 5.0 3.6 1.4 0.2 setosa 5.4 3.9 1.7 0.4 setosa 4.6 As a data scientist, you are interested in the minimal number of features among Sepal.Length, Sepal.Width, Petal.Length and Petal.Width that are able to partition the observations into 3 clusters since there are only subspecies setosa, versicolor and virginica in the data set. For example, it may be true that Petal.Length and Petal.Width do just as well as all of Sepal.Length, Sepal.Width, Petal.Length and Petal.Width for this task since Sepal.Length, Sepal.Width, Petal.Length and Petal.Width may be highly correlated and using 4 highly correlated features does not sufficiently improve the classification performance than using just the highly uncorrelated ones. You need to do the following: Q1. Study the pairwise correlations for the 4 features Sepal.Length, Sepal.Width, Petal.Length and Petal.Width, pick two features that are the least correlated, apply K-means with K = 3 to these features, and report how many obervations are correctly classified into a cluster, i.e., as being the same sub-species. Based on the selected features, what is the estimated number of clusters given by the gap statistic via the command clusGap? 3.5 1.4 ## ## 1 ## 2 ## 3 ## 4 ## 5 ## 6 Sepal.Length Sepal.Width Petal.Length Petal.Width Species 5.1 0.2 setosa 4.9 3.0 1.4 0.2 setosa 4.7 3.2 1.3 0.2 setosa 3.1 1.5 0.2 setosa 5.0 3.6 1.4 0.2 setosa 5.4 3.9 1.7 0.4 setosa 4.6 As a data scientist, you are interested in the minimal number of features among Sepal.Length, Sepal.Width, Petal.Length and Petal.Width that are able to partition the observations into 3 clusters since there are only subspecies setosa, versicolor and virginica in the data set. For example, it may be true that Petal.Length and Petal.Width do just as well as all of Sepal.Length, Sepal.Width, Petal.Length and Petal.Width for this task since Sepal.Length, Sepal.Width, Petal.Length and Petal.Width may be highly correlated and using 4 highly correlated features does not sufficiently improve the classification performance than using just the highly uncorrelated ones. You need to do the following: Q1. Study the pairwise correlations for the 4 features Sepal.Length, Sepal.Width, Petal.Length and Petal.Width, pick two features that are the least correlated, apply K-means with K = 3 to these features, and report how many obervations are correctly classified into a cluster, i.e., as being the same sub-species. Based on the selected features, what is the estimated number of clusters given by the gap statistic via the command clusGap