

Answered step by step
Verified Expert Solution
Question
1 Approved Answer
Please use stocks SUN, ANZ, COH, FMG & REA on the ASX stock market to answer the questions. index in alphabetical order of company code.
Please use stocks SUN, ANZ, COH, FMG & REA on the ASX stock market to answer the questions.
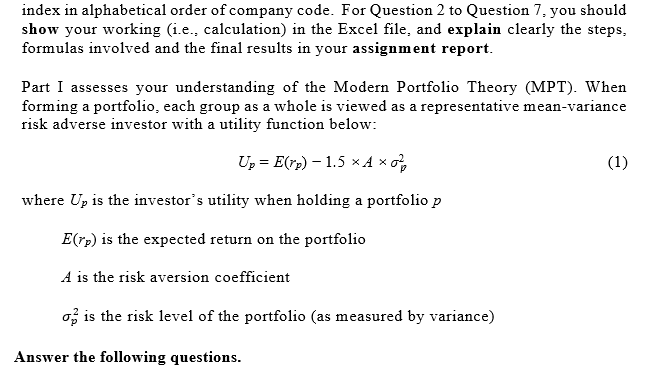
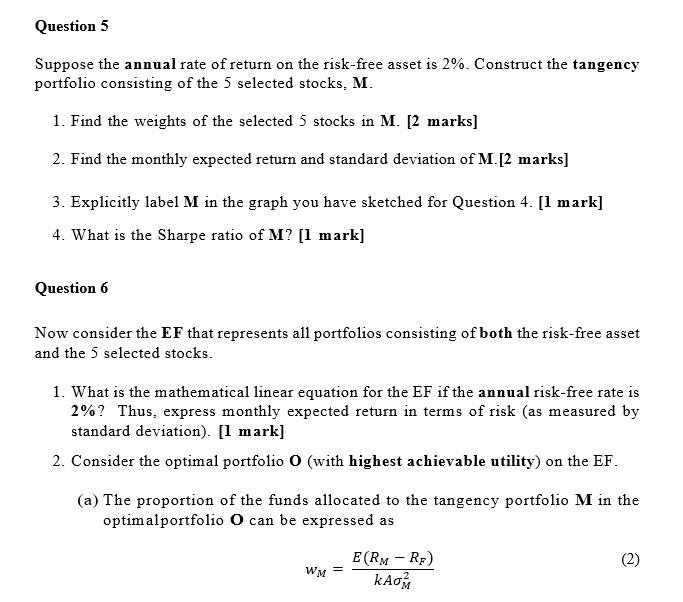
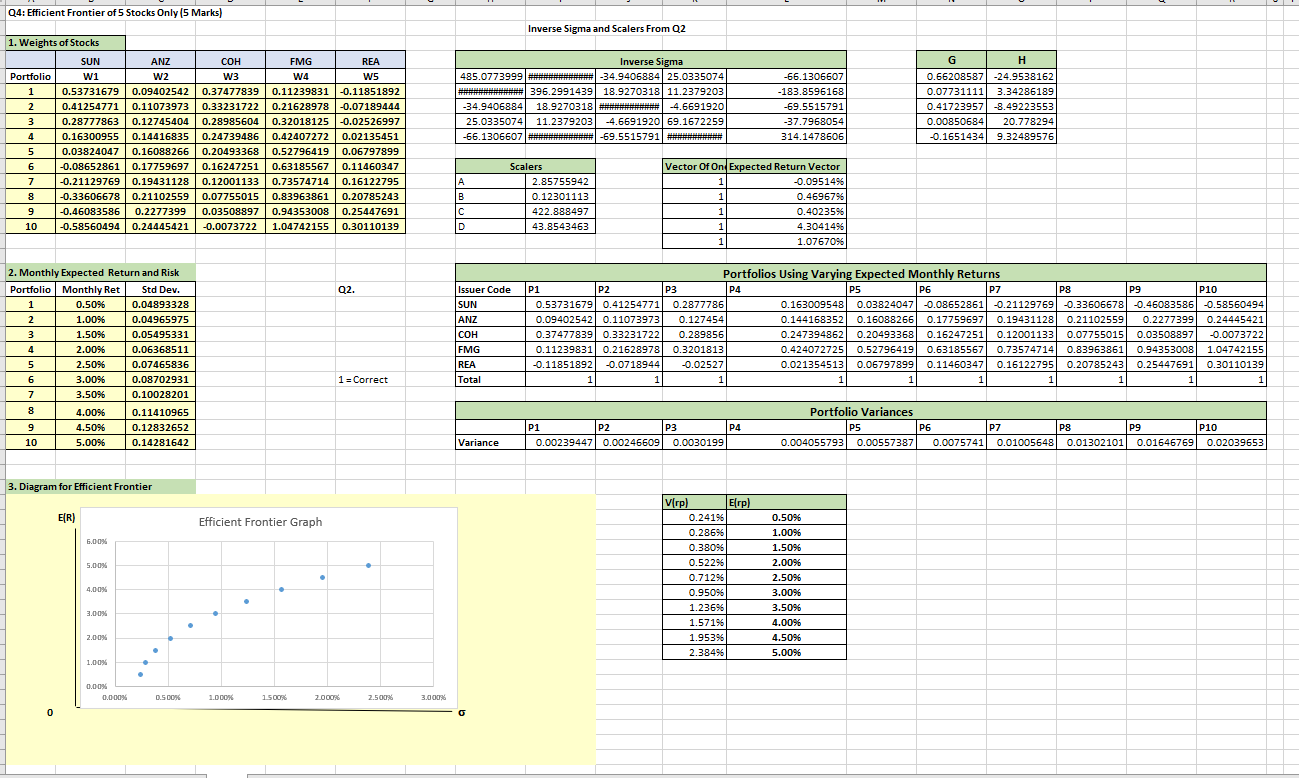
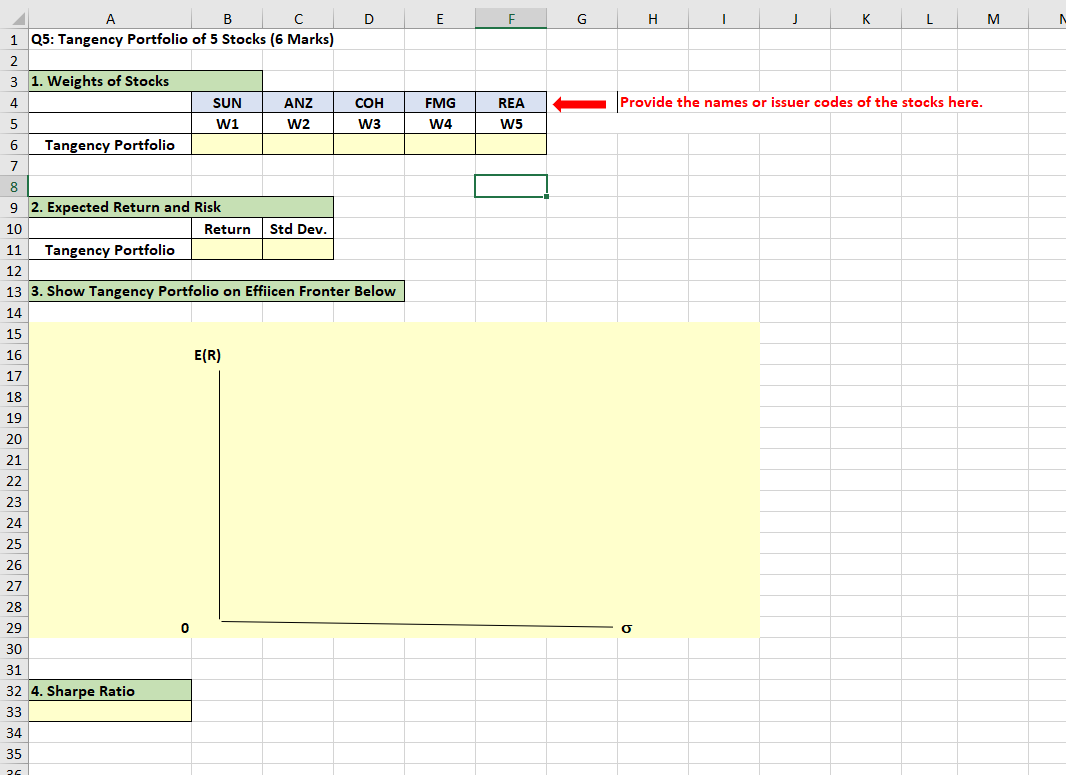
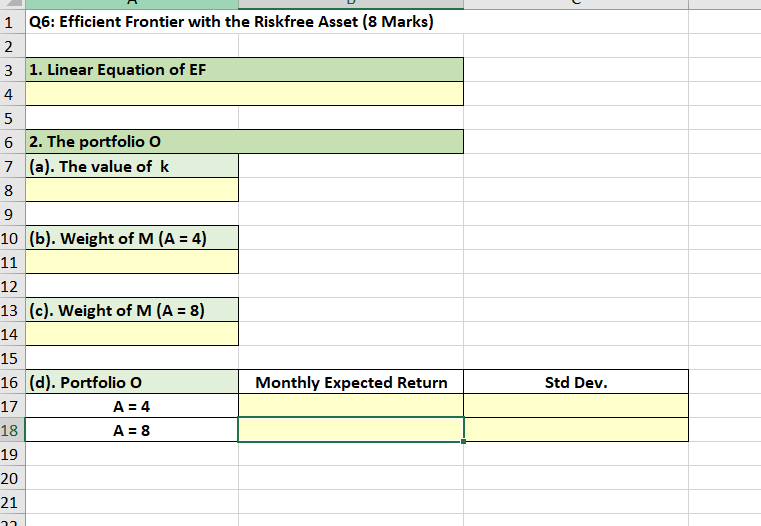
index in alphabetical order of company code. For Question 2 to Question 7, you should show your working (i.e., calculation) in the Excel file, and explain clearly the steps, formulas involved and the final results in your assignment report. Part I assesses your understanding of the Modern Portfolio Theory (MPT). When forming a portfolio, each group as a whole is viewed as a representative mean-variance risk adverse investor with a utility function below: Up = E(rp) - 1.5 A 0% (1) where Up is the investor's utility when holding a portfolio p E(rp) is the expected return on the portfolio A is the risk aversion coefficient o is the risk level of the portfolio (as measured by variance) Answer the following questions. Question 5 Suppose the annual rate of return on the risk-free asset is 2%. Construct the tangency portfolio consisting of the 5 selected stocks, M. 1. Find the weights of the selected 5 stocks in M. [2 marks] 2. Find the monthly expected return and standard deviation of M.[2 marks] 3. Explicitly label M in the graph you have sketched for Question 4. [1 mark] 4. What is the Sharpe ratio of M? [1 mark] Question 6 Now consider the EF that represents all portfolios consisting of both the risk-free asset and the 5 selected stocks. 1. What is the mathematical linear equation for the EF if the annual risk-free rate is 2%? Thus, express monthly expected return in terms of risk (as measured by standard deviation). [1 mark] 2. Consider the optimal portfolio O (with highest achievable utility) on the EF. (a) The proportion of the funds allocated to the tangency portfolio M in the optimalportfolio O can be expressed as E (RM - RF) (2) WM = KAOM Q4: Efficient Frontier of 5 Stocks Only (5 Marks) 1. Weights of Stocks FMG REA COH W3 Portfolio W4 W5 1 2 3 4 SUN ANZ W1 W2 0.53731679 0.09402542 0.37477839 0.11239831 -0.11851892 0.41254771 0.11073973 0.33231722 0.21628978 -0.07189444 0.28777863 0.12745404 0.28985604 0.32018125 -0.02526997 0.16300955 0.14416835 0.24739486 0.42407272 0.02135451 0.03824047 0.16088266 0.20493368 0.52796419 0.06797899 -0.08652861 0.17759697 0.16247251 0.63185567 0.11460347 -0.21129769 0.19431128 0.12001133 0.73574714 0.16122795 -0.33606678 0.21102559 0.07755015 0.83963861 0.20785243 -0.46083586 0.2277399 0.03508897 0.94353008 0.25447691 -0.58560494 0.24445421 -0.0073722 1.04742155 0.30110139 5 6 7 8 9 10 2. Monthly Expected Return and Risk Portfolio Monthly Ret Q2. Std Dev. 0.04893328 1 0.50% 1.00% 0.04965975 1.50% 0.05495331 2.00% 0.06368511 5 2.50% 0.07465836 6 3.00% 0.08702931 1 = Correct 7 3.50% 0.10028201 8 4.00% 0.11410965 9 4.50% 0.12832652 0.14281642 10 5.00% 3. Diagram for Efficient Frontier E(R) 6.00% 5.00% 4.00% 3.00% 2.00% 1.00% 0.00% 2 2 3 4 0 0.000% 0.500% Efficient Frontier Graph 1.000% 1.500% 2.000% 2.500% 3.000% Inverse Sigma and Scalers From Q2 Inverse Sigma 485.0773999 ############# -34.9406884 25.0335074 * 396.2991439 18.9270318 11.2379203 -34.9406884 18.9270318 ============ -4.6691920 25.0335074 11.2379203 -4.6691920 69.1672259 -66.1306607 ###= -69.5515791######===== -66.1306607 -183.8596168 -69.5515791 -37.7968054 314.1478606 G H 0.66208587 -24.9538162 0.07731111 3.34286189 0.41723957 -8.49223553 0.00850684 20.778294 -0.1651434 9.32489576 Scalers Vector Of On Expected Return Vector A 1 -0.09514% 2.85755942 0.12301113 B 1 0.46967% 422.888497 1 0.40235% 43.8543463 1 4.30414% 1.07670% 1 P4 P1 P2 P3 0.53731679 0.41254771 0.2877786 0.09402542 0.11073973 0.127454 0.37477839 0.33231722 0.289856 0.11239831 0.21628978 0.3201813 -0.11851892 -0.0718944 -0.02527 1 1 1 Portfolios Using Varying Expected Monthly Returns P5 P6 P7 P8 P9 P10 0.163009548 0.03824047 -0.08652861 -0.08652861 -0.21129769 -0.33606678 -0.46083586 -0.58560494 0.144168352 0.16088266 0.17759697 0.19431128 0.21102559 0.2277399 0.24445421 0.247394862 0.20493368 0.16247251 0.12001133 0.07755015 0.03508897 -0.0073722 0.424072725 0.52796419 0.63185567 0.73574714 0.83963861 0.94353008 1.04742155 0.021354513 0.06797899 0.11460347 0.16122795 0.20785243 0.25447691 0.30110139 1 1 1 1 1 1 1 P1 P3 P2 P4 0.00239447 0.00246609 0.0030199 Portfolio Variances P5 P6 P7 P8 P9 P10 0.004055793 0.00557387 0.0075741 0.01005648 0.01302101 0.01646769 0.02039653 V(rp) E(rp) 0.50% 1.00% 1.50% 2.00% 2.50% 3.00% 3.50% 4.00% 4.50% 5.00% D Issuer Code SUN ANZ COH FMG REA Total Variance 0.241% 0.286% 0.380% 0.522% 0.712% 0.950% 1.236% 1.571% 1.953% 2.384% A B 1 Q5: Tangency Portfolio of 5 Stocks (6 Marks) 2 3 1. Weights of Stocks 4 SUN ANZ 5 W1 W2 6 Tangency Portfolio 7 8 9 2. Expected Return and Risk 10 Return Std Dev. 11 Tangency Portfolio 12 13 3. Show Tangency Portfolio on Effiicen Fronter Below 14 15 16 E(R) 17 18 19 20 21 22 23 24 25 26 27 28 29 30 31 32 4. Sharpe Ratio 33 34 35 26 D COH W3 0 E FMG W4 F REA W5 G H J K L M Provide the names or issuer codes of the stocks here. O M 1 Q6: Efficient Frontier with the Riskfree Asset (8 Marks) 2 3 1. Linear Equation of EF 4 5 6 2. The portfolio O 7 (a). The value of k 8 9 10 (b). Weight of M (A = 4) 11 12 13 (c). Weight of M (A = 8) 14 15 16 (d). Portfolio O Monthly Expected Return 17 A = 4 18 A = 8 19 20 21 22 Std Dev. index in alphabetical order of company code. For Question 2 to Question 7, you should show your working (i.e., calculation) in the Excel file, and explain clearly the steps, formulas involved and the final results in your assignment report. Part I assesses your understanding of the Modern Portfolio Theory (MPT). When forming a portfolio, each group as a whole is viewed as a representative mean-variance risk adverse investor with a utility function below: Up = E(rp) - 1.5 A 0% (1) where Up is the investor's utility when holding a portfolio p E(rp) is the expected return on the portfolio A is the risk aversion coefficient o is the risk level of the portfolio (as measured by variance) Answer the following questions. Question 5 Suppose the annual rate of return on the risk-free asset is 2%. Construct the tangency portfolio consisting of the 5 selected stocks, M. 1. Find the weights of the selected 5 stocks in M. [2 marks] 2. Find the monthly expected return and standard deviation of M.[2 marks] 3. Explicitly label M in the graph you have sketched for Question 4. [1 mark] 4. What is the Sharpe ratio of M? [1 mark] Question 6 Now consider the EF that represents all portfolios consisting of both the risk-free asset and the 5 selected stocks. 1. What is the mathematical linear equation for the EF if the annual risk-free rate is 2%? Thus, express monthly expected return in terms of risk (as measured by standard deviation). [1 mark] 2. Consider the optimal portfolio O (with highest achievable utility) on the EF. (a) The proportion of the funds allocated to the tangency portfolio M in the optimalportfolio O can be expressed as E (RM - RF) (2) WM = KAOM Q4: Efficient Frontier of 5 Stocks Only (5 Marks) 1. Weights of Stocks FMG REA COH W3 Portfolio W4 W5 1 2 3 4 SUN ANZ W1 W2 0.53731679 0.09402542 0.37477839 0.11239831 -0.11851892 0.41254771 0.11073973 0.33231722 0.21628978 -0.07189444 0.28777863 0.12745404 0.28985604 0.32018125 -0.02526997 0.16300955 0.14416835 0.24739486 0.42407272 0.02135451 0.03824047 0.16088266 0.20493368 0.52796419 0.06797899 -0.08652861 0.17759697 0.16247251 0.63185567 0.11460347 -0.21129769 0.19431128 0.12001133 0.73574714 0.16122795 -0.33606678 0.21102559 0.07755015 0.83963861 0.20785243 -0.46083586 0.2277399 0.03508897 0.94353008 0.25447691 -0.58560494 0.24445421 -0.0073722 1.04742155 0.30110139 5 6 7 8 9 10 2. Monthly Expected Return and Risk Portfolio Monthly Ret Q2. Std Dev. 0.04893328 1 0.50% 1.00% 0.04965975 1.50% 0.05495331 2.00% 0.06368511 5 2.50% 0.07465836 6 3.00% 0.08702931 1 = Correct 7 3.50% 0.10028201 8 4.00% 0.11410965 9 4.50% 0.12832652 0.14281642 10 5.00% 3. Diagram for Efficient Frontier E(R) 6.00% 5.00% 4.00% 3.00% 2.00% 1.00% 0.00% 2 2 3 4 0 0.000% 0.500% Efficient Frontier Graph 1.000% 1.500% 2.000% 2.500% 3.000% Inverse Sigma and Scalers From Q2 Inverse Sigma 485.0773999 ############# -34.9406884 25.0335074 * 396.2991439 18.9270318 11.2379203 -34.9406884 18.9270318 ============ -4.6691920 25.0335074 11.2379203 -4.6691920 69.1672259 -66.1306607 ###= -69.5515791######===== -66.1306607 -183.8596168 -69.5515791 -37.7968054 314.1478606 G H 0.66208587 -24.9538162 0.07731111 3.34286189 0.41723957 -8.49223553 0.00850684 20.778294 -0.1651434 9.32489576 Scalers Vector Of On Expected Return Vector A 1 -0.09514% 2.85755942 0.12301113 B 1 0.46967% 422.888497 1 0.40235% 43.8543463 1 4.30414% 1.07670% 1 P4 P1 P2 P3 0.53731679 0.41254771 0.2877786 0.09402542 0.11073973 0.127454 0.37477839 0.33231722 0.289856 0.11239831 0.21628978 0.3201813 -0.11851892 -0.0718944 -0.02527 1 1 1 Portfolios Using Varying Expected Monthly Returns P5 P6 P7 P8 P9 P10 0.163009548 0.03824047 -0.08652861 -0.08652861 -0.21129769 -0.33606678 -0.46083586 -0.58560494 0.144168352 0.16088266 0.17759697 0.19431128 0.21102559 0.2277399 0.24445421 0.247394862 0.20493368 0.16247251 0.12001133 0.07755015 0.03508897 -0.0073722 0.424072725 0.52796419 0.63185567 0.73574714 0.83963861 0.94353008 1.04742155 0.021354513 0.06797899 0.11460347 0.16122795 0.20785243 0.25447691 0.30110139 1 1 1 1 1 1 1 P1 P3 P2 P4 0.00239447 0.00246609 0.0030199 Portfolio Variances P5 P6 P7 P8 P9 P10 0.004055793 0.00557387 0.0075741 0.01005648 0.01302101 0.01646769 0.02039653 V(rp) E(rp) 0.50% 1.00% 1.50% 2.00% 2.50% 3.00% 3.50% 4.00% 4.50% 5.00% D Issuer Code SUN ANZ COH FMG REA Total Variance 0.241% 0.286% 0.380% 0.522% 0.712% 0.950% 1.236% 1.571% 1.953% 2.384% A B 1 Q5: Tangency Portfolio of 5 Stocks (6 Marks) 2 3 1. Weights of Stocks 4 SUN ANZ 5 W1 W2 6 Tangency Portfolio 7 8 9 2. Expected Return and Risk 10 Return Std Dev. 11 Tangency Portfolio 12 13 3. Show Tangency Portfolio on Effiicen Fronter Below 14 15 16 E(R) 17 18 19 20 21 22 23 24 25 26 27 28 29 30 31 32 4. Sharpe Ratio 33 34 35 26 D COH W3 0 E FMG W4 F REA W5 G H J K L M Provide the names or issuer codes of the stocks here. O M 1 Q6: Efficient Frontier with the Riskfree Asset (8 Marks) 2 3 1. Linear Equation of EF 4 5 6 2. The portfolio O 7 (a). The value of k 8 9 10 (b). Weight of M (A = 4) 11 12 13 (c). Weight of M (A = 8) 14 15 16 (d). Portfolio O Monthly Expected Return 17 A = 4 18 A = 8 19 20 21 22 Std Dev
Step by Step Solution
There are 3 Steps involved in it
Step: 1

Get Instant Access to Expert-Tailored Solutions
See step-by-step solutions with expert insights and AI powered tools for academic success
Step: 2

Step: 3
Ace Your Homework with AI
Get the answers you need in no time with our AI-driven, step-by-step assistance
Get Started
Short Term Rental Long Term Wealth
Authors: Avery Carl
1st Edition
1947200445, 978-1947200449