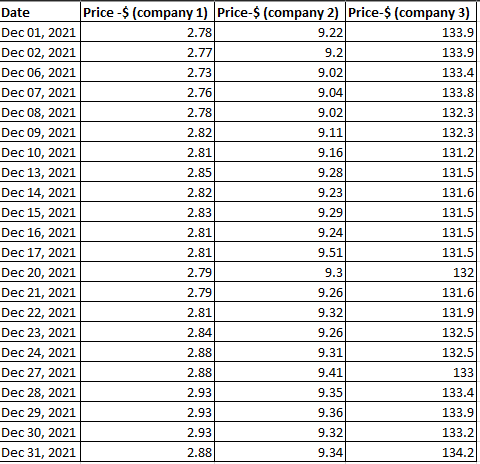
 Please use the following data. Thank you. Also Can you please show me the functions you use in excel. thanks

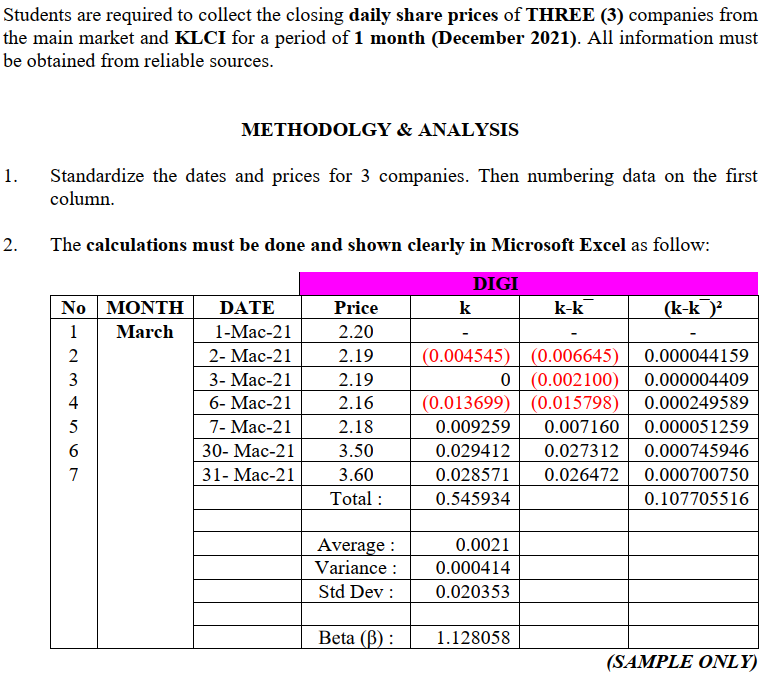
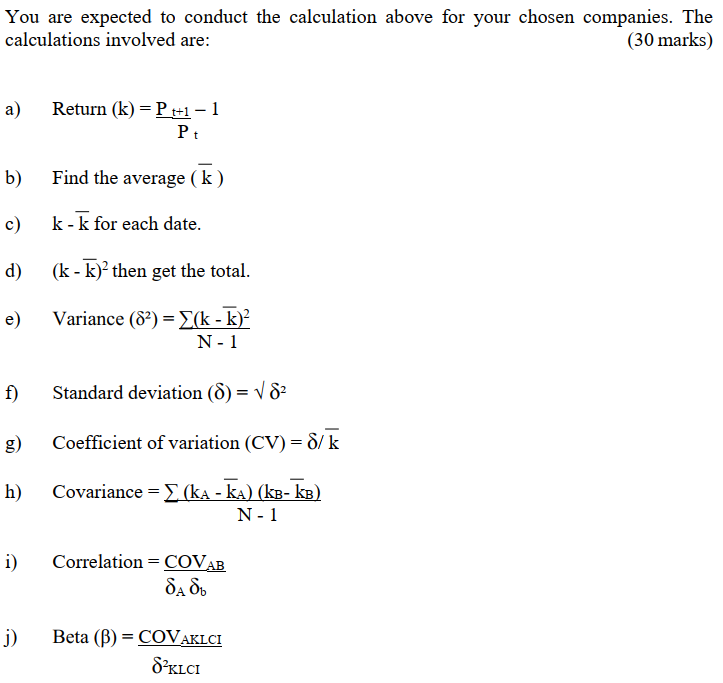
Students are required to collect the closing daily share prices of THREE (3) companies from the main market and KLCI for a period of 1 month (December 2021). All information must be obtained from reliable sources. METHODOLGY & ANALYSIS 1. Standardize the dates and prices for 3 companies. Then numbering data on the first column 2. The calculations must be done and shown clearly in Microsoft Excel as follow: DIGI k k-k (k-k) No MONTH 1 March 2 3 4 5 6 7 DATE 1-Mac-21 2- Mac-21 3- Mac-21 6-Mac-21 7- Mac-21 30- Mac-21 31-Mac-21 Price 2.20 2.19 2.19 2.16 2.18 3.50 3.60 Total : (0.004545) (0.006645) 0 (0.002100) (0.013699) (0.015798) 0.009259 0.007160 0.029412 0.027312 0.028571 0.026472 0.545934 0.000044159 0.000004409 0.000249589 0.000051259 0.000745946 0.000700750 0.107705516 Average : Variance : Std Dev : 0.0021 0.000414 0.020353 Beta (B): 1.128058 (SAMPLE ONLY) You are expected to conduct the calculation above for your chosen companies. The calculations involved are: (30 marks) a) Return (k) = P ++1 - 1 Pt b) Find the average ( k ) c) k-k for each date. d) (k - k)? then get the total. e) Variance (82) = {(k - k)? N-1 f) Standard deviation (0) = V 82 = g) Coefficient of variation (CV)=d/k h) ) Covariance = (ka - ka) (kB- kB) N1 i) Correlation = COVAB , j) Beta (B) = COVAKLCI SKLCI Date Price - $ (company 1) Price-$ (company 2) Price-$ (company 3) Dec 01, 2021 2.78 9.22 133.9 Dec 02, 2021 2.77 9.2 133.9 Dec 06, 2021 2.73 9.02 133.4 Dec 07, 2021 2.76 9.04 133.8 Dec 08, 2021 2.78 9.02 132.3 Dec 09, 2021 2.82 9.11 132.3 Dec 10, 2021 2.81 9.16 131.2 Dec 13, 2021 2.85 9.28 131.5 Dec 14, 2021 2.82 9.23 131.6 Dec 15, 2021 2.83 9.29 131.5 Dec 16, 2021 2.81 9.24 131.5 Dec 17, 2021 2.81 9.51 131.5 Dec 20, 2021 2.79 9.3 132 Dec 21, 2021 2.79 9.26 131.6 Dec 22, 2021 2.81 9.32 131.9 Dec 23, 2021 2.84 9.26 132.5 Dec 24, 2021 2.88 9.31 132.5 Dec 27, 2021 2.88 9.41 133 Dec 28, 2021 2.93 9.35 133.4 Dec 29, 2021 2.93 9.36 133.9 Dec 30, 2021 2.93 9.32 133.2 Dec 31, 2021 2.88 9.34 134.2 Students are required to collect the closing daily share prices of THREE (3) companies from the main market and KLCI for a period of 1 month (December 2021). All information must be obtained from reliable sources. METHODOLGY & ANALYSIS 1. Standardize the dates and prices for 3 companies. Then numbering data on the first column 2. The calculations must be done and shown clearly in Microsoft Excel as follow: DIGI k k-k (k-k) No MONTH 1 March 2 3 4 5 6 7 DATE 1-Mac-21 2- Mac-21 3- Mac-21 6-Mac-21 7- Mac-21 30- Mac-21 31-Mac-21 Price 2.20 2.19 2.19 2.16 2.18 3.50 3.60 Total : (0.004545) (0.006645) 0 (0.002100) (0.013699) (0.015798) 0.009259 0.007160 0.029412 0.027312 0.028571 0.026472 0.545934 0.000044159 0.000004409 0.000249589 0.000051259 0.000745946 0.000700750 0.107705516 Average : Variance : Std Dev : 0.0021 0.000414 0.020353 Beta (B): 1.128058 (SAMPLE ONLY) You are expected to conduct the calculation above for your chosen companies. The calculations involved are: (30 marks) a) Return (k) = P ++1 - 1 Pt b) Find the average ( k ) c) k-k for each date. d) (k - k)? then get the total. e) Variance (82) = {(k - k)? N-1 f) Standard deviation (0) = V 82 = g) Coefficient of variation (CV)=d/k h) ) Covariance = (ka - ka) (kB- kB) N1 i) Correlation = COVAB , j) Beta (B) = COVAKLCI SKLCI Date Price - $ (company 1) Price-$ (company 2) Price-$ (company 3) Dec 01, 2021 2.78 9.22 133.9 Dec 02, 2021 2.77 9.2 133.9 Dec 06, 2021 2.73 9.02 133.4 Dec 07, 2021 2.76 9.04 133.8 Dec 08, 2021 2.78 9.02 132.3 Dec 09, 2021 2.82 9.11 132.3 Dec 10, 2021 2.81 9.16 131.2 Dec 13, 2021 2.85 9.28 131.5 Dec 14, 2021 2.82 9.23 131.6 Dec 15, 2021 2.83 9.29 131.5 Dec 16, 2021 2.81 9.24 131.5 Dec 17, 2021 2.81 9.51 131.5 Dec 20, 2021 2.79 9.3 132 Dec 21, 2021 2.79 9.26 131.6 Dec 22, 2021 2.81 9.32 131.9 Dec 23, 2021 2.84 9.26 132.5 Dec 24, 2021 2.88 9.31 132.5 Dec 27, 2021 2.88 9.41 133 Dec 28, 2021 2.93 9.35 133.4 Dec 29, 2021 2.93 9.36 133.9 Dec 30, 2021 2.93 9.32 133.2 Dec 31, 2021 2.88 9.34 134.2

 Please use the following data. Thank you. Also Can you please show me the functions you use in excel. thanks


