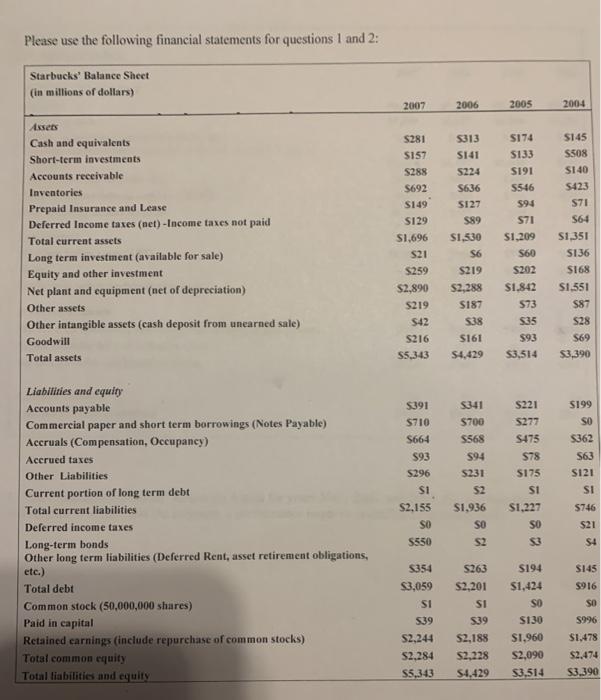
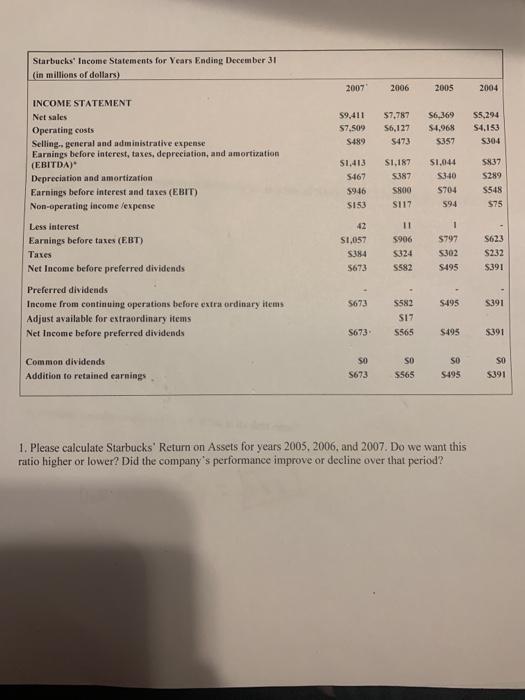
Please use the following financial statements for questions 1 and 2: Starbucks' Balance Sheet (in millions of dollars) 2007 2006 2005 2004 5281 S157 S288 S692 $149 Assets Cash and equivalents Short-term investments Accounts receivable Inventories Prepaid Insurance and Lease Deferred Income taxes (net) -Income taxes not paid Total current assets Long term investment (available for sale) Equity and other investment Net plant and equipment (net of depreciation) Other assets Other intangible assets (cash deposit from unearned sale) Goodwill Total assets S129 S1,696 S21 5259 S2,890 5219 S42 S216 S5343 5313 SI41 5224 S636 5127 589 S1.530 S6 S219 S2,288 S187 538 S161 54,429 SI74 5133 S191 5546 594 571 $1,209 S60 S202 $1.842 573 $35 593 $3,514 S145 5508 SI 40 S423 S71 S64 $1,351 S136 S168 $1,551 587 528 S69 $3,390 S199 SO Liabilities and equiry Accounts payable Commercial paper and short term borrowings (Notes Payable) Accruals (Compensation, Occupancy) Accrued taxes Other Liabilities Current portion of long term debt Total current liabilities Deferred income taxes Long-term bonds Other long term liabilities (Deferred Rent, asset retirement obligations, etc.) Total debt Common stock (50,000,000 shares) Paid in capital Retained earnings (include repurchase of common stocks) Total common equity Total liabilities and equity 5391 $710 S664 93 S296 SI S2.155 SO 5550 5341 $700 5568 $94 5231 S2 $1,936 SO S2 S221 5277 S475 $78 $175 SI S1,227 SO 53 5362 563 SI21 SI 5746 $21 $4 5354 $3,059 SI 539 S263 $2,201 SI S145 $916 SO S194 $1,424 SO S130 $1,960 S2,090 $3,514 539 S2,188 S2,228 S4.429 S2,244 S2,284 S5,343 S996 $1.478 S2.474 $3.390 Starbucks Income Statements for Years Ending December 31 (in millions of dollars) 2007 2006 2005 2004 59,411 57,509 5489 $7,787 56,127 5473 S6,369 $4.968 5357 55.294 S4.153 5304 INCOME STATEMENT Net sales Operating costs Selling general and administrative expense Earnings before interest, taxes, depreciation, and amortization (EBITDA) Depreciation and amortization Earnings before interest and taxes (EBIT) Non-operating income /expense S1,413 5-167 $946 $153 SI.187 5387 5800 S117 51,044 53.40 5704 594 $837 5289 S548 $75 1 42 S1,057 5384 5673 11 5906 5324 5582 $797 5302 $495 S623 S232 S391 Less interest Earnings before taxes (EBT) Tanes Net Income before preferred dividends Preferred dividends Income from continuing operations before extraordinary items Adjust available for extraordinary items Net Income before preferred dividends 5673 S495 S391 5582 S17 5565 S673 $495 $391 SO Common dividends Addition to retained earnings SO 5565 SO $495 SO S391 5673 1. Please calculate Starbucks' Return on Assets for years 2005, 2006, and 2007. Do we want this ratio higher or lower? Did the company's performance improve or decline over that period? 2. Please calculate Starbucks' Return on Equity for years 2005, 2006, and 2007. Do we want this ratio higher or lower? Did the company's performance improve or decline over that period? 3. Was Starbucks' performance over time better in terms of ROA or ROE? What is the reason for this