Please use the following picture attached to answer the questions. I need help with steps to solve and find the answers please.
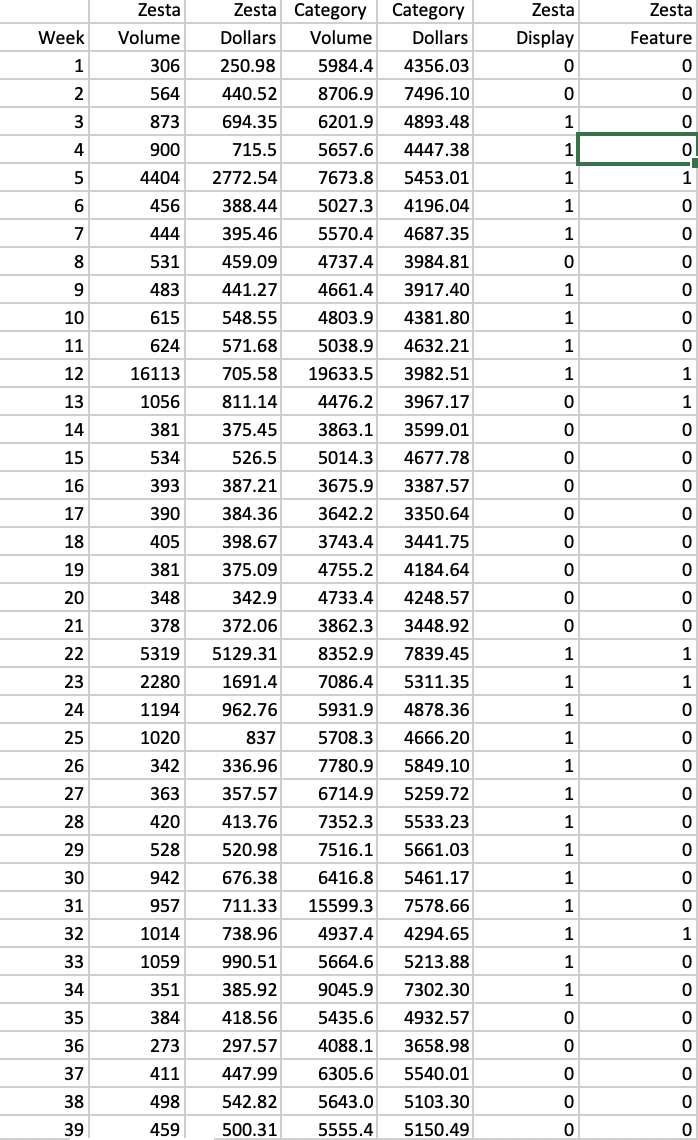
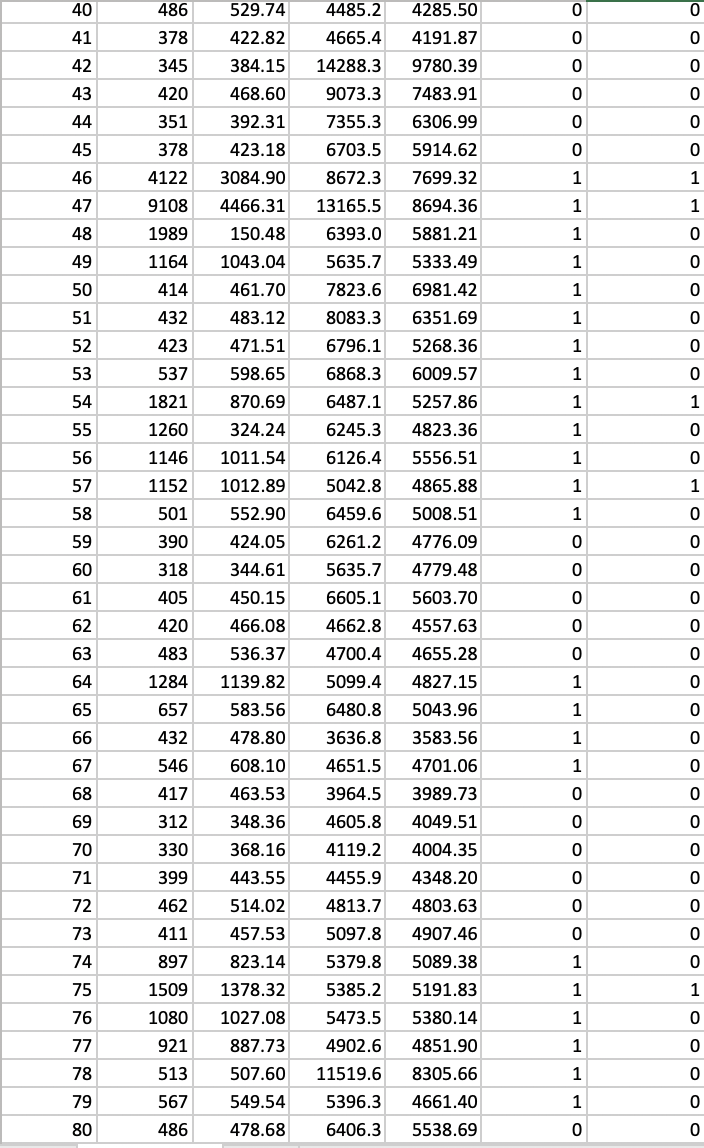
Saltine crackers are purchased by over 80 of all households in the US. Sales promotions, including features, displays, and price reductions are extremely important in this category. The major brands are Nabisco Premium, Keebler Zesta, and Sunshine Krispy. The data in the spreadsheet zesta.xls summarize sales all the stores in a US city for a total of 80 weeks. There are data on the sales (volume and dollar) of both Zesta and the category as a whole, as well as information on whether or not any form of feature or display activity for Zesta was present each week The brand manager for Zesta would like to know how its pricing and promotional activities affect its sales and, if so, by how much. You will need to create some new variables from the provided data. First, you need to compute the average competitor price this can be derived from the category and Zesta sales data. Other variables may need to be created over time. Before you begin the analysis, describe your data. It is also useful to make use of graphs in order to get a \"feel\" for the data. 1. Analysis of Brand Sales: Linear Model a) Estimate a linear model to answer Zesta's brand manager's question, b) Note that your outcome variable should be volume sales, not dollar sales why? c) Interpret the regression outputs. d) Are you condent in your model? 2. Analysis of Brand Sales: Exponential Model a) Estimate an exponential model to answer Zesta's brand manager's question. b) What is Zesta's own price elasticity? Interpret this. c) What is Zesta's cross-price elastlcity? Interpret this. 3. What are some limitations of this dataset? Zesta Zesta Category Category Zesta Zesta Week Volume Dollars Volume Dollars Display Feature 306 250.98 5984.4 4356.03 564 440.52 8706.9 7496.10 O W N P 0 873 694.35 6201.9 4893.48 H O St 900 715.5 5657.6 4447.38 5 4404 2772.54 7673.8 5453.01 TH H 6 456 388.44 5027.3 4196.04 O ON 444 395.46 5570.4 4687.35 0 8 531 459.09 4737.4 3984.81 0 9 483 441.27 4661.4 3917.40 0 10 615 548.55 4803.9 4381.80 0 11 624 571.68 5038.9 4632.21 0 12 16113 705.58 19633.5 3982.51 13 105 811.14 4476.2 3967.17 O O 14 381 375.45 3863.1 3599.01 15 526.5 5014.3 4677.78 o c 534 o 16 393 387.21 3675.9 3387.57 17 3642.2 3350.64 o 390 384.36 0 18 405 398.67 3743.4 3441.75 19 381 375.09 4755.2 4184.64 20 348 342.9 4733.4 4248.57 21 378 372.06 3862.3 3448.92 22 5319 5129.31 8352.9 7839.45 23 2280 1691.4 7086.4 5311.35 24 1194 962.76 5931.9 4878.36 0 25 1020 837 5708.3 4666.20 26 342 336.96 7780.9 5849.10 27 363 357.57 6714.9 5259.72 28 420 413.76 7352.3 5533.23 29 528 520.98 7516.1 5661.03 0 30 942 676.38 6416.8 5461.17 0 31 957 711.33 15599.3 7578.66 32 1014 738.96 4937.4 4294.65 33 1059 990.51 5664.6 5213.88 34 351 385.92 9045.9 7302.30 35 384 418.56 5435.6 4932.57 O 0 36 273 297.57 4088.1 3658.98 0 0 37 411 447.99 6305.6 5540.01 oo 0 38 498 542.82 5643.0 5103.30 o c 39 459 500.31 5555.4 5150.49 O\f