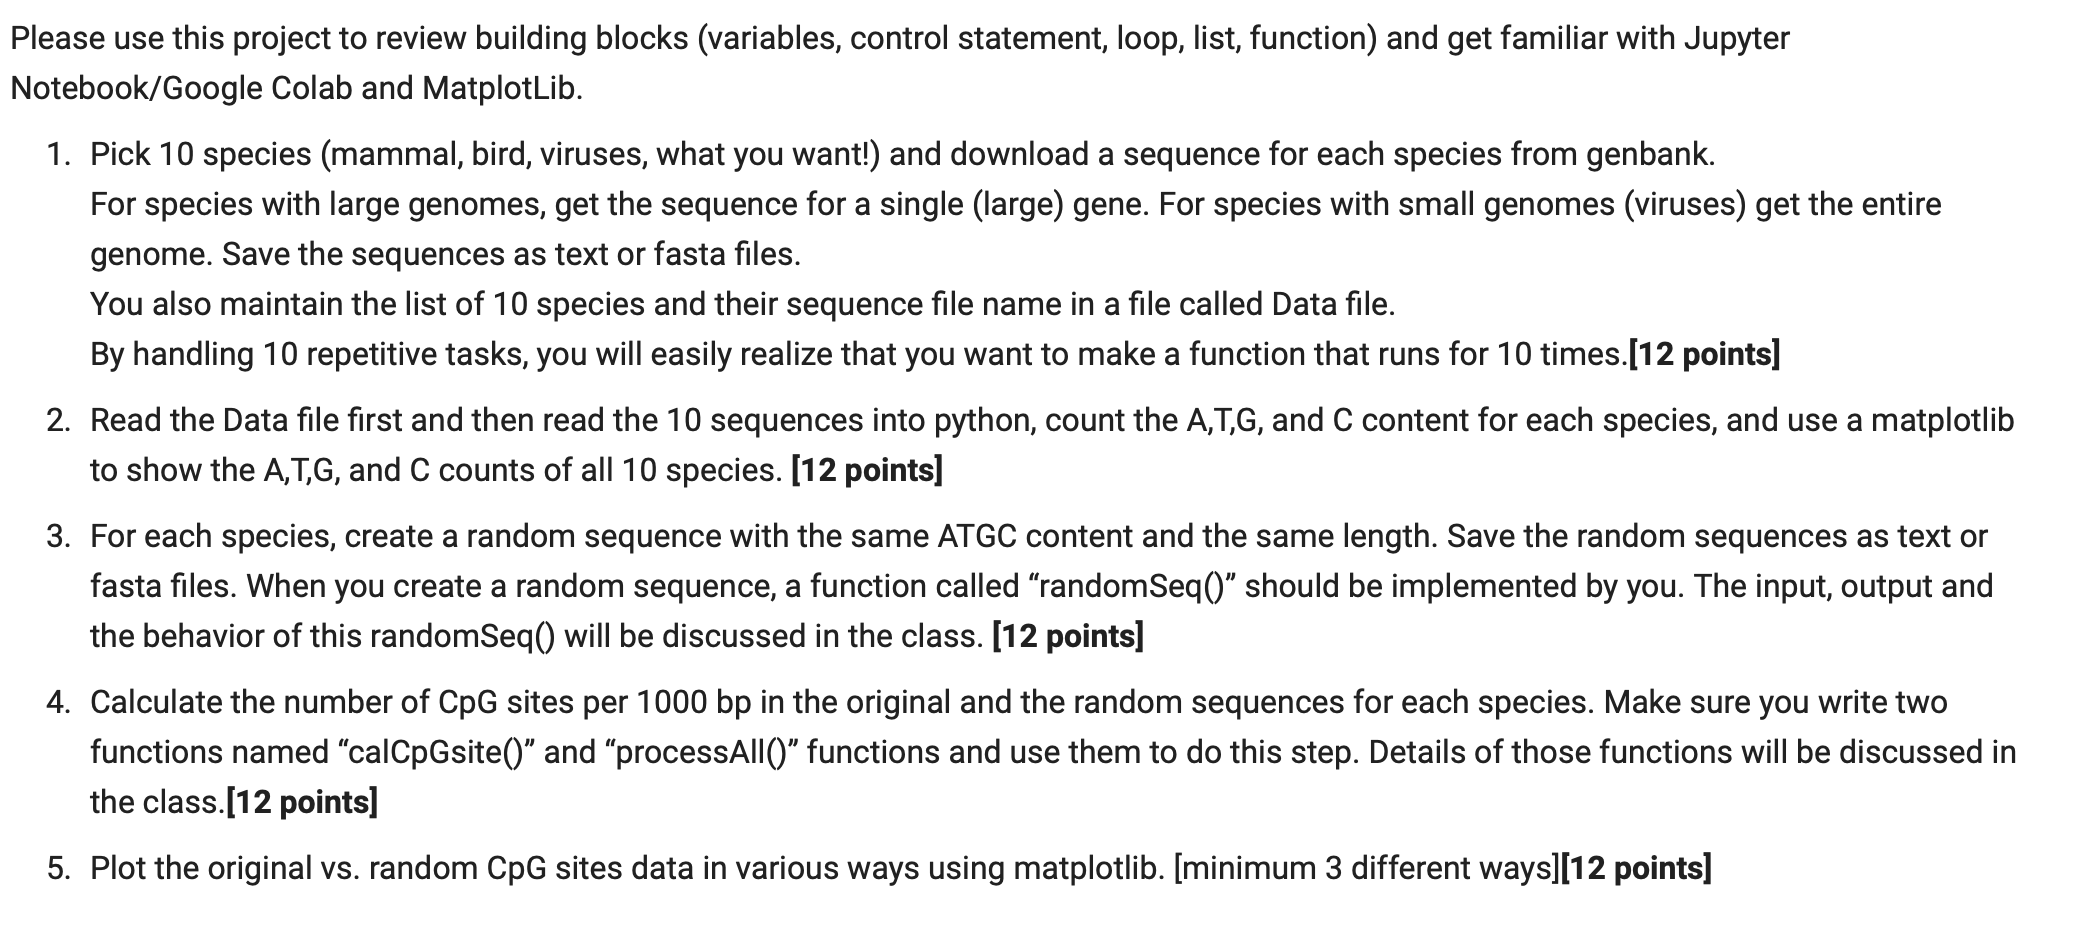
Please use this project to review building blocks (variables, control statement, loop, list, function) and get familiar with Jupyter Notebook/Google Colab and MatplotLib. 1. Pick 10 species (mammal, bird, viruses, what you want!) and download a sequence for each species from genbank. For species with large genomes, get the sequence for a single (large) gene. For species with small genomes (viruses) get the entire genome. Save the sequences as text or fasta files. You also maintain the list of 10 species and their sequence file name in a file called Data file. By handling 10 repetitive tasks, you will easily realize that you want to make a function that runs for 10 times.[12 points] 2. Read the Data file first and then read the 10 sequences into python, count the A,T,G, and C content for each species, and use a matplotlib to show the A, T,G, and C counts of all 10 species. (12 points) 3. For each species, create a random sequence with the same ATGC content and the same length. Save the random sequences as text or fasta files. When you create a random sequence, a function called "randomSeq()" should be implemented by you. The input, output and the behavior of this randomSeq() will be discussed in the class. [12 points) 4. Calculate the number of CpG sites per 1000 bp in the original and the random sequences for each species. Make sure you write two functions named "calCpGsite() and processAll() functions and use them to do this step. Details of those functions will be discussed in the class.[12 points] 5. Plot the original vs. random CPG sites data in various ways using matplotlib. [minimum 3 different ways][12 points) Please use this project to review building blocks (variables, control statement, loop, list, function) and get familiar with Jupyter Notebook/Google Colab and MatplotLib. 1. Pick 10 species (mammal, bird, viruses, what you want!) and download a sequence for each species from genbank. For species with large genomes, get the sequence for a single (large) gene. For species with small genomes (viruses) get the entire genome. Save the sequences as text or fasta files. You also maintain the list of 10 species and their sequence file name in a file called Data file. By handling 10 repetitive tasks, you will easily realize that you want to make a function that runs for 10 times.[12 points] 2. Read the Data file first and then read the 10 sequences into python, count the A,T,G, and C content for each species, and use a matplotlib to show the A, T,G, and C counts of all 10 species. (12 points) 3. For each species, create a random sequence with the same ATGC content and the same length. Save the random sequences as text or fasta files. When you create a random sequence, a function called "randomSeq()" should be implemented by you. The input, output and the behavior of this randomSeq() will be discussed in the class. [12 points) 4. Calculate the number of CpG sites per 1000 bp in the original and the random sequences for each species. Make sure you write two functions named "calCpGsite() and processAll() functions and use them to do this step. Details of those functions will be discussed in the class.[12 points] 5. Plot the original vs. random CPG sites data in various ways using matplotlib. [minimum 3 different ways][12 points)


