

PLEASE USE THIS SPREADSHEET FORMAT EXAMPLE
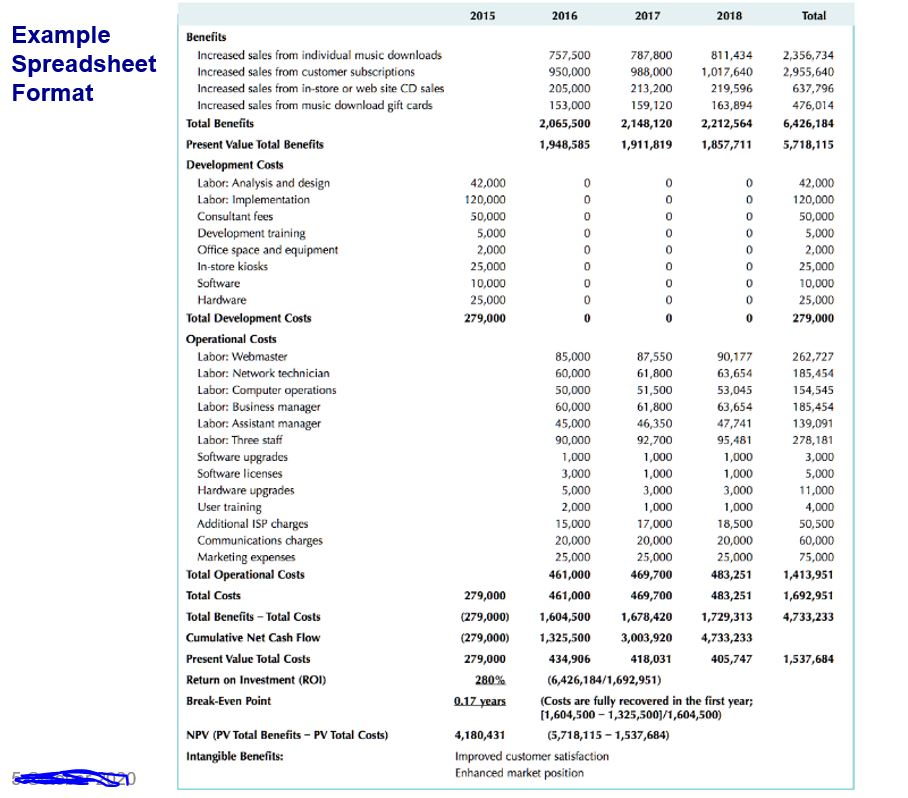
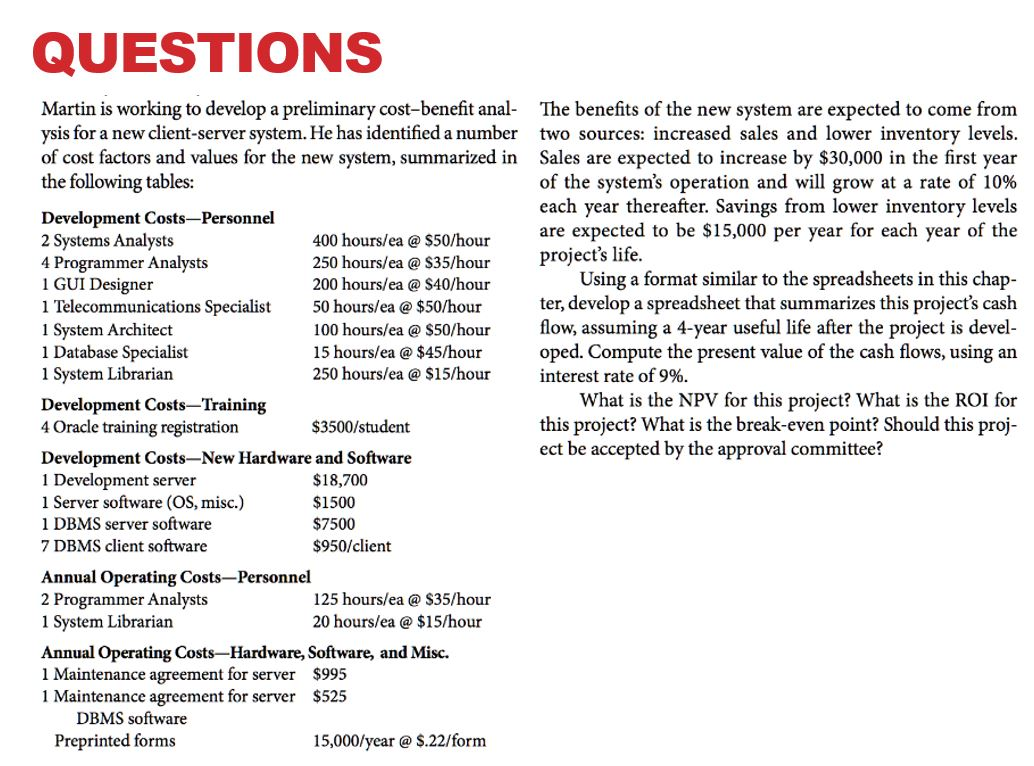
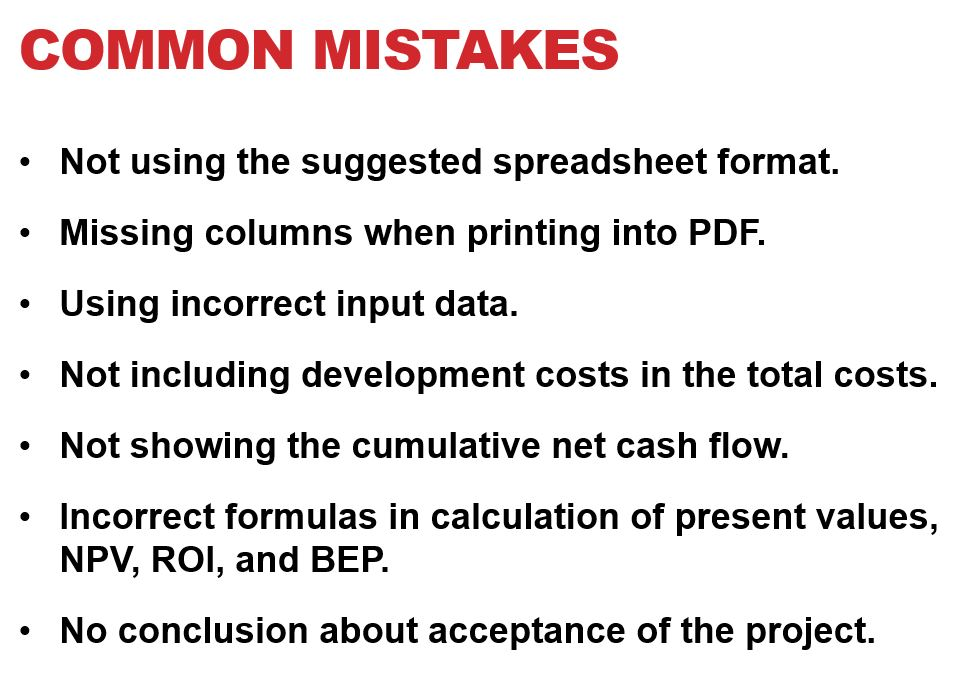
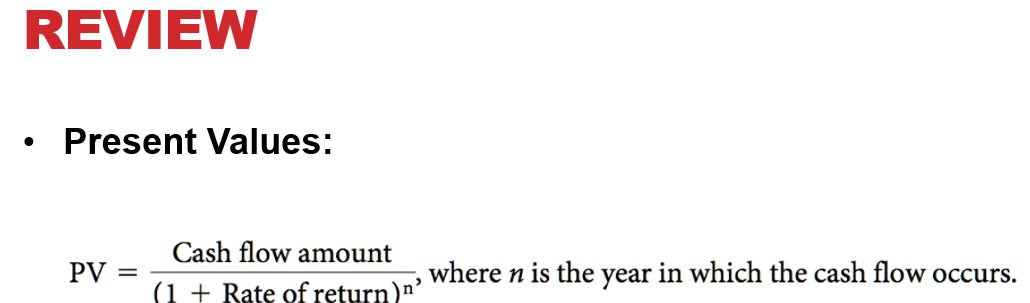
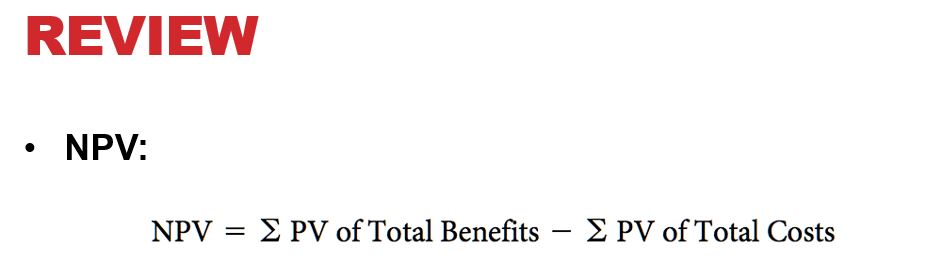
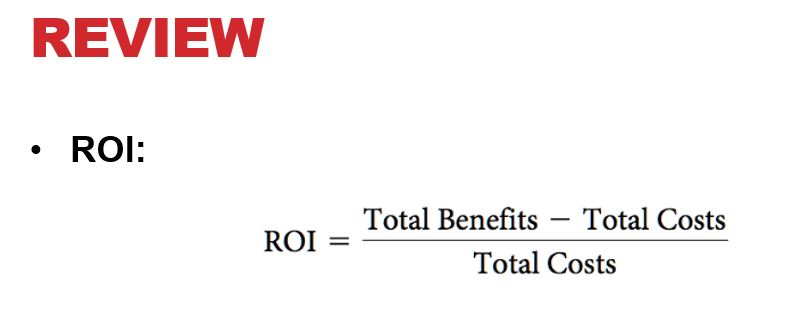
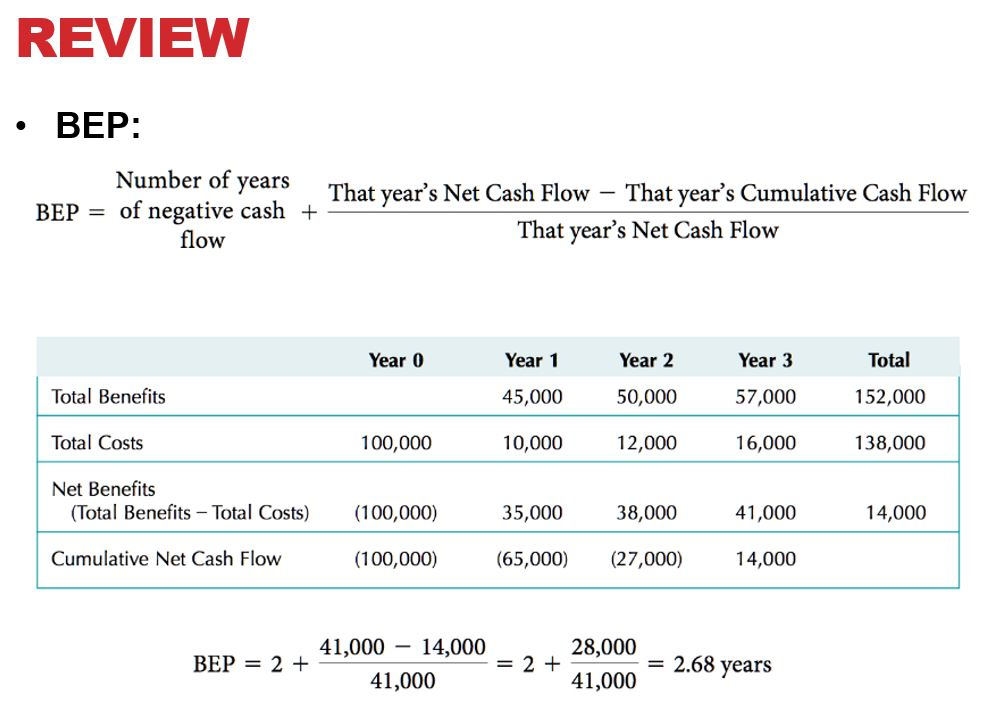
QUESTIONS Martin is working to develop a preliminary cost-benefit anal- ysis for a new client-server system. He has identified a number of cost factors and values for the new system, summarized in the following tables: Development Costs-Personnel 2 Systems Analysts 400 hours/ea @ $50/hour 4 Programmer Analysts 250 hours/ea @ $35/hour 1 GUI Designer 200 hours/ea @ $40/hour 1 Telecommunications Specialist 50 hours/ea @ $50/hour 1 System Architect 100 hours/ea @ $50/hour 1 Database Specialist 15 hours/ea @ $45/hour 1 System Librarian 250 hours/ea @ $15/hour Development Costs-Training 4 Oracle training registration $3500/student Development Costs-New Hardware and Software 1 Development server $18,700 1 Server software (OS, misc.) $1500 1 DBMS server software $7500 7 DBMS client software $950/client Annual Operating Costs-Personnel 2 Programmer Analysts 125 hours/ea @ $35/hour 1 System Librarian 20 hours/ea @ $15/hour Annual Operating costs-Hardware, Software, and Misc. 1 Maintenance agreement for server $995 1 Maintenance agreement for server $525 DBMS software Preprinted forms 15,000/year @ $.22/form The benefits of the new system are expected to come from two sources: increased sales and lower inventory levels. Sales are expected to increase by $30,000 in the first year of the system's operation and will grow at a rate of 10% each year thereafter. Savings from lower inventory levels are expected to be $15,000 per year for each year of the project's life. Using a format similar to the spreadsheets in this chap- ter, develop a spreadsheet that summarizes this project's cash flow, assuming a 4-year useful life after the project is devel- oped. Compute the present value of the cash flows, using an interest rate of 9%. What is the NPV for this project? What is the ROI for this project? What is the break-even point? Should this proj- ect be accepted by the approval committee? NOTES . Increase rate of annual personnel costs: 4% NOTES . Considered period is Years 0-4 Development costs are for Year 0 only. COMMON MISTAKES Not using the suggested spreadsheet format. Missing columns when printing into PDF. Using incorrect input data. . Not including development costs in the total costs. Not showing the cumulative net cash flow. Incorrect formulas in calculation of present values, NPV, ROI, and BEP. . No conclusion about acceptance of the project. REVIEW . Present Values: PV Cash flow amount where n is the year in which the cash flow occurs. (1 + Rate of return)n' REVIEW . NPV: NPV PV of Total Benefits PV of Total Costs REVIEW . ROI: ROI Total Benefits Total Costs Total Costs REVIEW BEP: Number of years That year's Net Cash Flow That year's Cumulative Cash Flow BEP = of negative cash + flow That year's Net Cash Flow Year 0 Year 1 Year 2 Year 3 Total Total Benefits 45,000 50,000 57,000 152,000 Total Costs 100,000 10,000 12,000 16,000 138,000 Net Benefits (Total Benefits - Total Costs) (100,000) 35,000 38,000 41,000 14,000 Cumulative Net Cash Flow (100,000) (65,000) (27,000) 14,000 41,000 14,000 28,000 BEP = 2 + = 2 + 41,000 41,000 = 2.68 years 2015 2016 2017 2018 Total Example Spreadsheet Format 757,500 950,000 205,000 153,000 2,065,500 1,948,585 787,800 988,000 213,200 159,120 2,148,120 1,911,819 811,434 1,017,640 219,596 163,894 2,212,564 1,857,711 2,356,734 2,955,640 637,796 476,014 6,426,184 5,718,115 42,000 120,000 50,000 5,000 2,000 25,000 10,000 25,000 279,000 0 0 0 0 0 0 0 0 0 0 0 0 0 0 0 0 0 0 0 0 42,000 120,000 50,000 5,000 2,000 25,000 10,000 25,000 279,000 0 0 0 0 0 0 Benefits Increased sales from individual music downloads Increased sales from customer subscriptions Increased sales from in-store or web site CD sales Increased sales from music download gift cards Total Benefits Present Value Total Benefits Development Costs Labor: Analysis and design Labor: Implementation Consultant fees Development training Office space and equipment In-store kiosks Software Hardware Total Development Costs Operational Costs Labor: Webmaster Labor: Network technician Labor: Computer operations Labor: Business manager Labor: Assistant manager Labor: Three staff Software upgrades Software licenses Hardware upgrades User training Additional ISP charges Communications charges Marketing expenses Total Operational Costs Total Costs Total Benefits - Total Costs Cumulative Net Cash Flow Present Value Total Costs Return on Investment (ROI) Break-Even Point NPV (PV Total Benefits - PV Total Costs) Intangible Benefits: 61,800 85,000 87,550 90,177 60,000 61,800 63,654 50,000 51,500 53,045 60,000 63,654 45,000 46,350 47,741 90,000 92,700 95,481 1,000 1,000 1,000 3,000 1,000 1,000 5,000 3,000 3,000 2,000 1,000 1,000 15,000 17,000 18,500 20,000 20,000 20,000 25,000 25,000 25,000 461,000 469,700 483,251 279,000 461,000 469,700 483,251 (279,000) 1,604,500 1,678,420 1,729,313 (279,000) 1,325,500 3,003,920 4,733,233 279,000 434,906 418,031 405,747 280% (6,426,184/1,692,951) 0.17 years (Costs are fully recovered in the first year; (1,604,500 - 1,325,5001/1,604,500) 4,180,431 (5,718,115 - 1,537,684) Improved customer satisfaction Enhanced market position 262,727 185,454 154,545 185,454 139,091 278,181 3,000 5,000 11,000 4,000 50,500 60,000 75,000 1,413,951 1,692,951 4,733,233 1,537,684 QUESTIONS Martin is working to develop a preliminary cost-benefit anal- ysis for a new client-server system. He has identified a number of cost factors and values for the new system, summarized in the following tables: Development Costs-Personnel 2 Systems Analysts 400 hours/ea @ $50/hour 4 Programmer Analysts 250 hours/ea @ $35/hour 1 GUI Designer 200 hours/ea @ $40/hour 1 Telecommunications Specialist 50 hours/ea @ $50/hour 1 System Architect 100 hours/ea @ $50/hour 1 Database Specialist 15 hours/ea @ $45/hour 1 System Librarian 250 hours/ea @ $15/hour Development Costs-Training 4 Oracle training registration $3500/student Development Costs-New Hardware and Software 1 Development server $18,700 1 Server software (OS, misc.) $1500 1 DBMS server software $7500 7 DBMS client software $950/client Annual Operating Costs-Personnel 2 Programmer Analysts 125 hours/ea @ $35/hour 1 System Librarian 20 hours/ea @ $15/hour Annual Operating costs-Hardware, Software, and Misc. 1 Maintenance agreement for server $995 1 Maintenance agreement for server $525 DBMS software Preprinted forms 15,000/year @ $.22/form The benefits of the new system are expected to come from two sources: increased sales and lower inventory levels. Sales are expected to increase by $30,000 in the first year of the system's operation and will grow at a rate of 10% each year thereafter. Savings from lower inventory levels are expected to be $15,000 per year for each year of the project's life. Using a format similar to the spreadsheets in this chap- ter, develop a spreadsheet that summarizes this project's cash flow, assuming a 4-year useful life after the project is devel- oped. Compute the present value of the cash flows, using an interest rate of 9%. What is the NPV for this project? What is the ROI for this project? What is the break-even point? Should this proj- ect be accepted by the approval committee? NOTES . Increase rate of annual personnel costs: 4% NOTES . Considered period is Years 0-4 Development costs are for Year 0 only. COMMON MISTAKES Not using the suggested spreadsheet format. Missing columns when printing into PDF. Using incorrect input data. . Not including development costs in the total costs. Not showing the cumulative net cash flow. Incorrect formulas in calculation of present values, NPV, ROI, and BEP. . No conclusion about acceptance of the project. REVIEW . Present Values: PV Cash flow amount where n is the year in which the cash flow occurs. (1 + Rate of return)n' REVIEW . NPV: NPV PV of Total Benefits PV of Total Costs REVIEW . ROI: ROI Total Benefits Total Costs Total Costs REVIEW BEP: Number of years That year's Net Cash Flow That year's Cumulative Cash Flow BEP = of negative cash + flow That year's Net Cash Flow Year 0 Year 1 Year 2 Year 3 Total Total Benefits 45,000 50,000 57,000 152,000 Total Costs 100,000 10,000 12,000 16,000 138,000 Net Benefits (Total Benefits - Total Costs) (100,000) 35,000 38,000 41,000 14,000 Cumulative Net Cash Flow (100,000) (65,000) (27,000) 14,000 41,000 14,000 28,000 BEP = 2 + = 2 + 41,000 41,000 = 2.68 years 2015 2016 2017 2018 Total Example Spreadsheet Format 757,500 950,000 205,000 153,000 2,065,500 1,948,585 787,800 988,000 213,200 159,120 2,148,120 1,911,819 811,434 1,017,640 219,596 163,894 2,212,564 1,857,711 2,356,734 2,955,640 637,796 476,014 6,426,184 5,718,115 42,000 120,000 50,000 5,000 2,000 25,000 10,000 25,000 279,000 0 0 0 0 0 0 0 0 0 0 0 0 0 0 0 0 0 0 0 0 42,000 120,000 50,000 5,000 2,000 25,000 10,000 25,000 279,000 0 0 0 0 0 0 Benefits Increased sales from individual music downloads Increased sales from customer subscriptions Increased sales from in-store or web site CD sales Increased sales from music download gift cards Total Benefits Present Value Total Benefits Development Costs Labor: Analysis and design Labor: Implementation Consultant fees Development training Office space and equipment In-store kiosks Software Hardware Total Development Costs Operational Costs Labor: Webmaster Labor: Network technician Labor: Computer operations Labor: Business manager Labor: Assistant manager Labor: Three staff Software upgrades Software licenses Hardware upgrades User training Additional ISP charges Communications charges Marketing expenses Total Operational Costs Total Costs Total Benefits - Total Costs Cumulative Net Cash Flow Present Value Total Costs Return on Investment (ROI) Break-Even Point NPV (PV Total Benefits - PV Total Costs) Intangible Benefits: 61,800 85,000 87,550 90,177 60,000 61,800 63,654 50,000 51,500 53,045 60,000 63,654 45,000 46,350 47,741 90,000 92,700 95,481 1,000 1,000 1,000 3,000 1,000 1,000 5,000 3,000 3,000 2,000 1,000 1,000 15,000 17,000 18,500 20,000 20,000 20,000 25,000 25,000 25,000 461,000 469,700 483,251 279,000 461,000 469,700 483,251 (279,000) 1,604,500 1,678,420 1,729,313 (279,000) 1,325,500 3,003,920 4,733,233 279,000 434,906 418,031 405,747 280% (6,426,184/1,692,951) 0.17 years (Costs are fully recovered in the first year; (1,604,500 - 1,325,5001/1,604,500) 4,180,431 (5,718,115 - 1,537,684) Improved customer satisfaction Enhanced market position 262,727 185,454 154,545 185,454 139,091 278,181 3,000 5,000 11,000 4,000 50,500 60,000 75,000 1,413,951 1,692,951 4,733,233 1,537,684