Answered step by step
Verified Expert Solution
Link Copied!

Question

1 Approved Answer

Please use Ti-84 15.) Use a = 0.05. The sample statistics listed below are from independent samples. The sample statistics: nj = 60, x1 =

Please use Ti-84
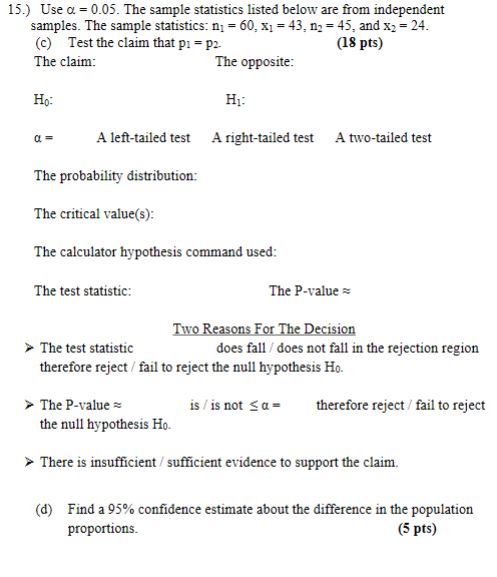
image text in transcribed
15.) Use a = 0.05. The sample statistics listed below are from independent samples. The sample statistics: nj = 60, x1 = 43, ny = 45, and x2 = 24. (c) Test the claim that pi = p2- (18 pts) The claim: The opposite: Ho: HI: 0= A left-tailed test A right-tailed test A two-tailed test The probability distribution: The critical value(s): The calculator hypothesis command used: The test statistic: The P-value = Two Reasons For The Decision The test statistic does fall / does not fall in the rejection region therefore reject / fail to reject the null hypothesis Ho. >The P-value = is / is not sa= therefore reject / fail to reject the null hypothesis Ho. > There is insufficient / sufficient evidence to support the claim. (d) Find a 95% confidence estimate about the difference in the population proportions. (5 pts)

Step by Step Solution

There are 3 Steps involved in it

Step: 1

blur-text-image

Get Instant Access to Expert-Tailored Solutions

See step-by-step solutions with expert insights and AI powered tools for academic success

Step: 2

blur-text-image

Step: 3

blur-text-image

Ace Your Homework with AI

Get the answers you need in no time with our AI-driven, step-by-step assistance

Get Started

Recommended Textbook for

Practical Linear Algebra A Geometry Toolbox

Authors: Gerald Farin, Dianne Hansford

4th Edition

1003051219, 9781003051213

More Books

Students also viewed these Mathematics questions

Question

Describe the types of power that effective leaders employ

Answered: 1 week ago

Question

Describe how leadership styles should be adapted to the situation

Answered: 1 week ago