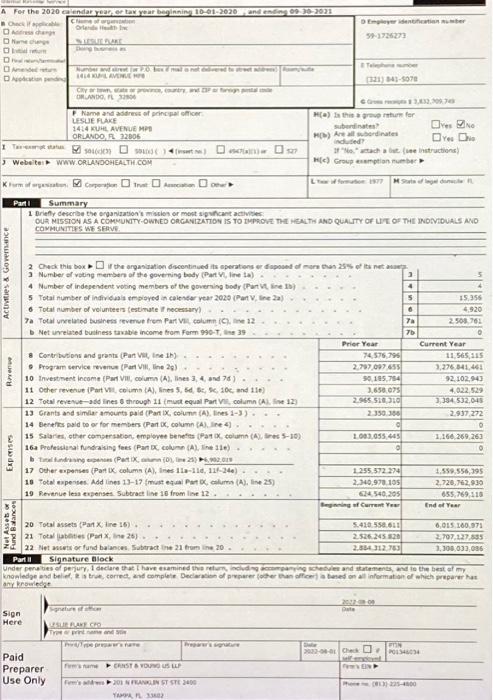
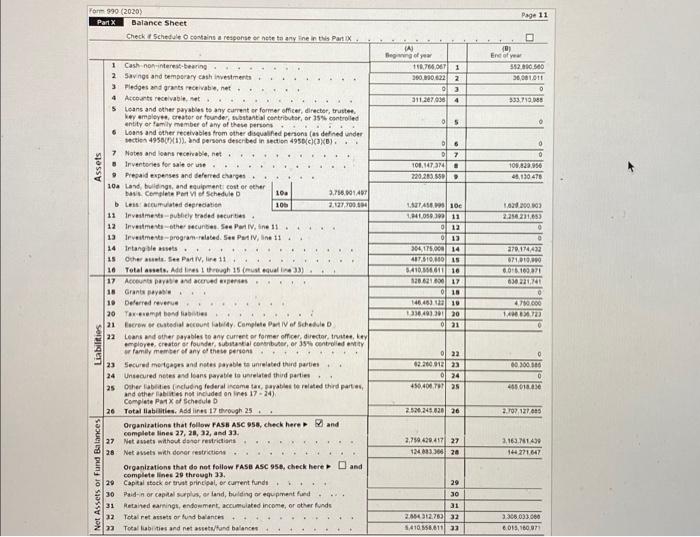
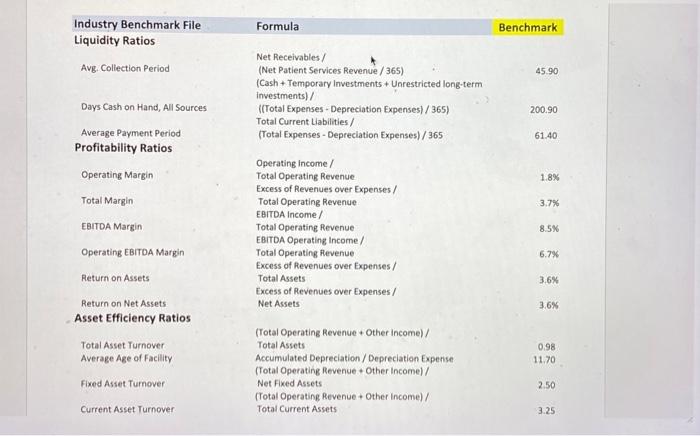
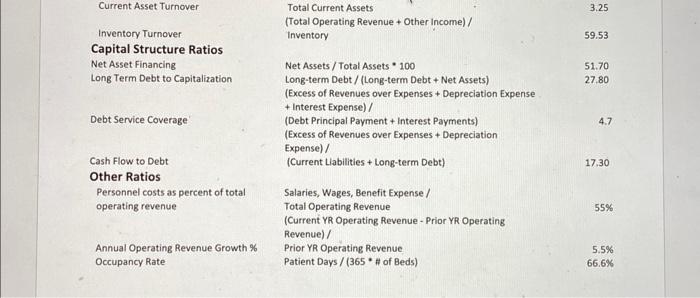
Please write a 1-page paper after analyzing Orlando Health's Form 990 during the calendar year of 2021 to include the following: 1st Paragraph: Provide an overview of what a Form 990 is, what key financial statements are included within this report and a high-level summary of your findings regarding Orlando Health's financial status. Be sure to support your summary of their financial health using your findings based on all of thd analyses you performed on their financial statements. 2nd - 4th Paragraphs: Please choose 1 ratio per paragraph ( 3 total ratios) and explain how you calculated it (explain the formula and then show the values), how the calculated ratio compares to the industry benchmark, and what the value tells you about how the organization is performing. DO NOT USE THE CURRENT RATIO. You must show your Industry Benchmark File Liquidity Ratios Avg. Collection Period Days Cash on Hand, All Sources Average Payment Period Profitability Ratios Operating Margin Total Margin EBITDA Margin Operating EBITDA Margin Return on Assets Return on Net Assets Asset Efficiency Ratios Total Asset Tumover Average Age of Facility Fixed Asset Tumover Current Asset Turnover Formula Benchmark Net Receivables / (Net Patient Services Revenue / 365) (Cash + Temporary Investments + Unrestricted long-term investments) / ((Total Expenses - Depreciation Expenses) / 365) 45.90 Total Current Liabilities / (Total Expenses - Depreciation Expenses) / 365 200.90 61.40 Operating income / Total Operating Revenue 1.8% Excess of Revenues over Expenses / Total Operating Revenue 3.7% EBITDA Income / Total Operating Revenue EBITDA Operating Income / Total Operating frevenue Excess of Revenues over Expenses / Total Assets Excess of Revenues over Expenses / Net Assets 8.5% 6.7% 3.6% 3.6% (Total Operating Revenue + Other income)/ Total Assets Accumulated Depreciation / Depreciation Expense (Total Operating Revenue + Other Income) / Net Fixed Assets (Total Operating Revenue + Other Income) / Total Current Assets 0.98 11.70 2.50 3.25 Current Asset Turnover Inventory Turnover Capital Structure Ratios Net Asset Financing Long Term Debt to Capitalization Total Current Assets (Total Operating Revenue + Other Income) / Inventory Net Assets / Total Assets * 100 Long-term Debt / (Long-term Debt + Net Assets) (Excess of Revenues over Expenses + Depreciation Expense + Interest Expense) / (Debt Principal Payment + Interest Payments) (Excess of Revenues over Expenses + Depreciation Expense) / (Current Liabilities + Long-term Debt) Salaries, Wages, Benefit Expense / Total Operating Revenue (Current YR Operating Revenue - Prior YR Operating Revenue)/ Prior YR Operating Revenue Patient Days / (365* \# of Beds) 3.25 59.53 51.70 27.80 4.7 17.30 55% 5.5% 66.6% Please write a 1-page paper after analyzing Orlando Health's Form 990 during the calendar year of 2021 to include the following: 1st Paragraph: Provide an overview of what a Form 990 is, what key financial statements are included within this report and a high-level summary of your findings regarding Orlando Health's financial status. Be sure to support your summary of their financial health using your findings based on all of thd analyses you performed on their financial statements. 2nd - 4th Paragraphs: Please choose 1 ratio per paragraph ( 3 total ratios) and explain how you calculated it (explain the formula and then show the values), how the calculated ratio compares to the industry benchmark, and what the value tells you about how the organization is performing. DO NOT USE THE CURRENT RATIO. You must show your Industry Benchmark File Liquidity Ratios Avg. Collection Period Days Cash on Hand, All Sources Average Payment Period Profitability Ratios Operating Margin Total Margin EBITDA Margin Operating EBITDA Margin Return on Assets Return on Net Assets Asset Efficiency Ratios Total Asset Tumover Average Age of Facility Fixed Asset Tumover Current Asset Turnover Formula Benchmark Net Receivables / (Net Patient Services Revenue / 365) (Cash + Temporary Investments + Unrestricted long-term investments) / ((Total Expenses - Depreciation Expenses) / 365) 45.90 Total Current Liabilities / (Total Expenses - Depreciation Expenses) / 365 200.90 61.40 Operating income / Total Operating Revenue 1.8% Excess of Revenues over Expenses / Total Operating Revenue 3.7% EBITDA Income / Total Operating Revenue EBITDA Operating Income / Total Operating frevenue Excess of Revenues over Expenses / Total Assets Excess of Revenues over Expenses / Net Assets 8.5% 6.7% 3.6% 3.6% (Total Operating Revenue + Other income)/ Total Assets Accumulated Depreciation / Depreciation Expense (Total Operating Revenue + Other Income) / Net Fixed Assets (Total Operating Revenue + Other Income) / Total Current Assets 0.98 11.70 2.50 3.25 Current Asset Turnover Inventory Turnover Capital Structure Ratios Net Asset Financing Long Term Debt to Capitalization Total Current Assets (Total Operating Revenue + Other Income) / Inventory Net Assets / Total Assets * 100 Long-term Debt / (Long-term Debt + Net Assets) (Excess of Revenues over Expenses + Depreciation Expense + Interest Expense) / (Debt Principal Payment + Interest Payments) (Excess of Revenues over Expenses + Depreciation Expense) / (Current Liabilities + Long-term Debt) Salaries, Wages, Benefit Expense / Total Operating Revenue (Current YR Operating Revenue - Prior YR Operating Revenue)/ Prior YR Operating Revenue Patient Days / (365* \# of Beds) 3.25 59.53 51.70 27.80 4.7 17.30 55% 5.5% 66.6%