Answered step by step
Verified Expert Solution
Question
1 Approved Answer
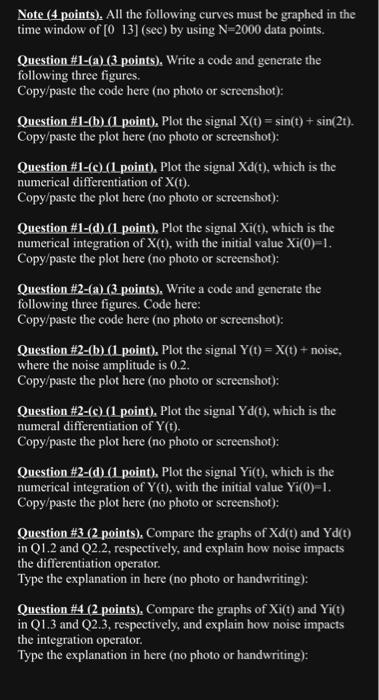
please write a c++ using namespace std and show the output Note (4 points). All the following curves must be graphed in the time window
please write a c++ using namespace std and show the output 
Note (4 points). All the following curves must be graphed in the time window of [013] (sec) by using N=2000 data points. Question \#l-(a) (3 points), Write a code and generate the following three figures. Copy/paste the code here (no photo or screenshot): Question \#l-(b)_(1 point), Plot the signalX(t)=sin(t)+sin(2t). Copy/paste the plot here (no photo or screenshot): Question\#1-(c)_(1 point), Plot the signal Xd(t), which is the numerical differentiation of X(t). Copy/paste the plot here (no photo or screenshot): Question \#1-(d) (1 point)s Plot the signal Xi(t), which is the numerical integration of X(t), with the initial value Xi(0)=1. Copy/paste the plot here (no photo or screenshot): Question $2-(a) (3 points), Write a code and generate the following three figures. Code here: Copy/paste the code here (no photo or screenshot): Question \#2-(b) (1 point), Plot the signal Y(t)=X(t)+ noise, where the noise amplitude is 0.2 . Copy/paste the plot here (no photo or screenshot): Question \#2-(c) (1 point), Plot the signal Yd(t), which is the numeral differentiation of Y(t). Copy/paste the plot here (no photo or screenshot): Question \#2-(d) (1 point), Plot the signal Yi(t), which is the numerical integration of Y(t), with the initial value Yi(0)=1. Copy/paste the plot here (no photo or screenshot): Question $3 (2 points), Compare the graphs of Xd(t) and Yd(t) in Q1.2 and Q2.2, respectively, and explain how noise impacts the differentiation operator. Type the explanation in here (no photo or handwriting): Question \#4 (2 points), Compare the graphs of Xi(t) and Yi(t) in Q1.3 and Q2.3, respectively, and explain how noise impacts the integration operator. Type the explanation in here (no photo or handwriting) 
Step by Step Solution
There are 3 Steps involved in it
Step: 1

Get Instant Access to Expert-Tailored Solutions
See step-by-step solutions with expert insights and AI powered tools for academic success
Step: 2

Step: 3

Ace Your Homework with AI
Get the answers you need in no time with our AI-driven, step-by-step assistance
Get Started


