

Answered step by step
Verified Expert Solution
Question
1 Approved Answer
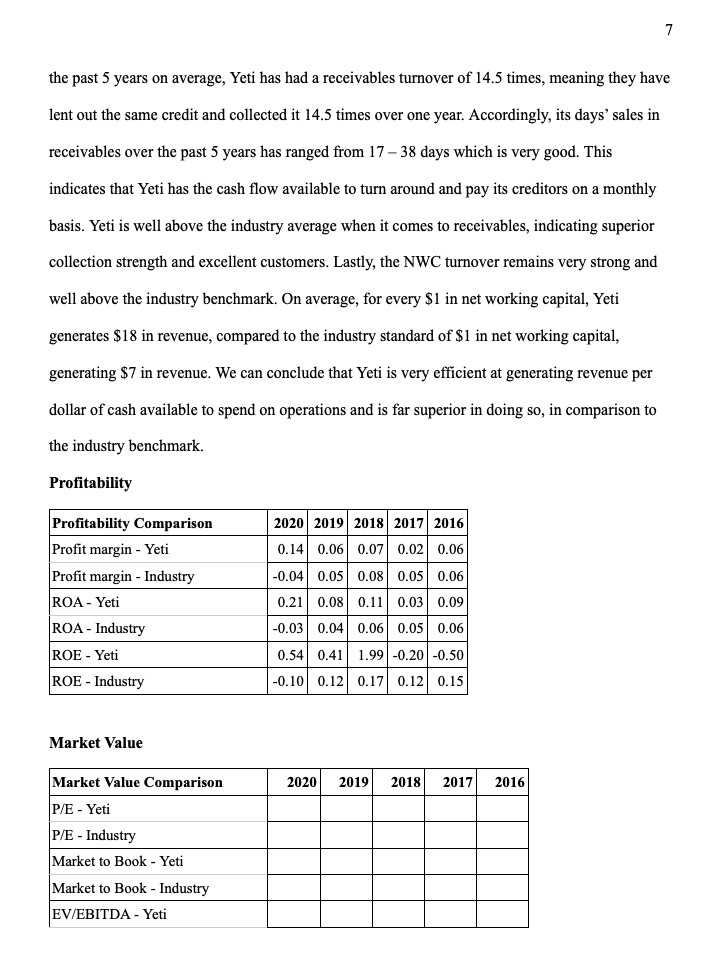
Please write a one-page executive summary, synopsis of your analysis including recommendations. 3 Introduction YETI was founded in 2006 by two brothers who saw a
Please write a one-page executive summary, synopsis of your analysis including recommendations.
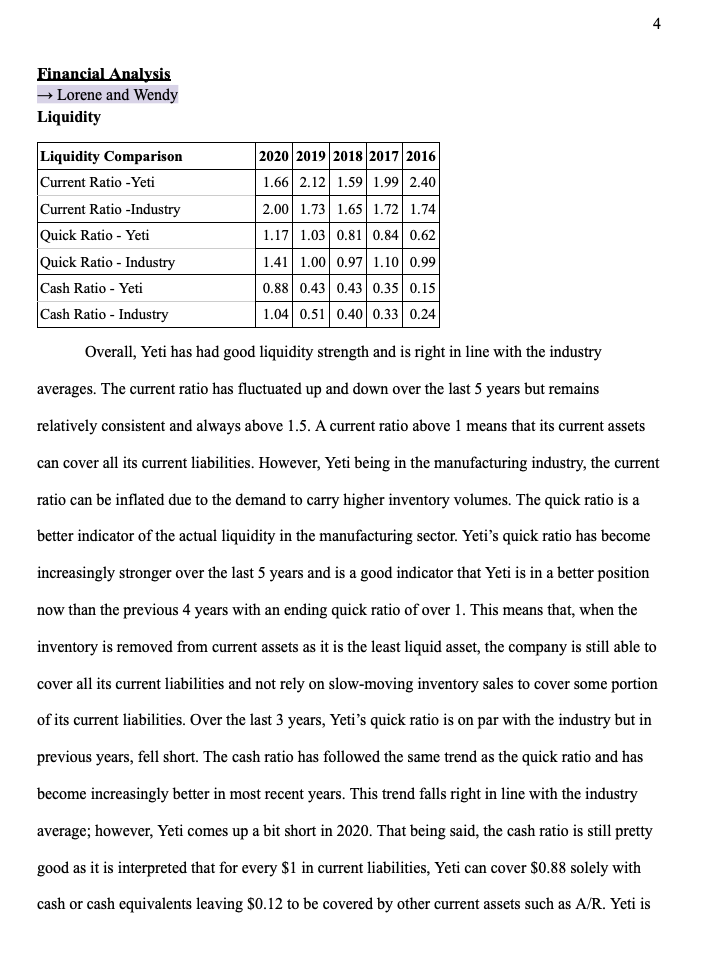
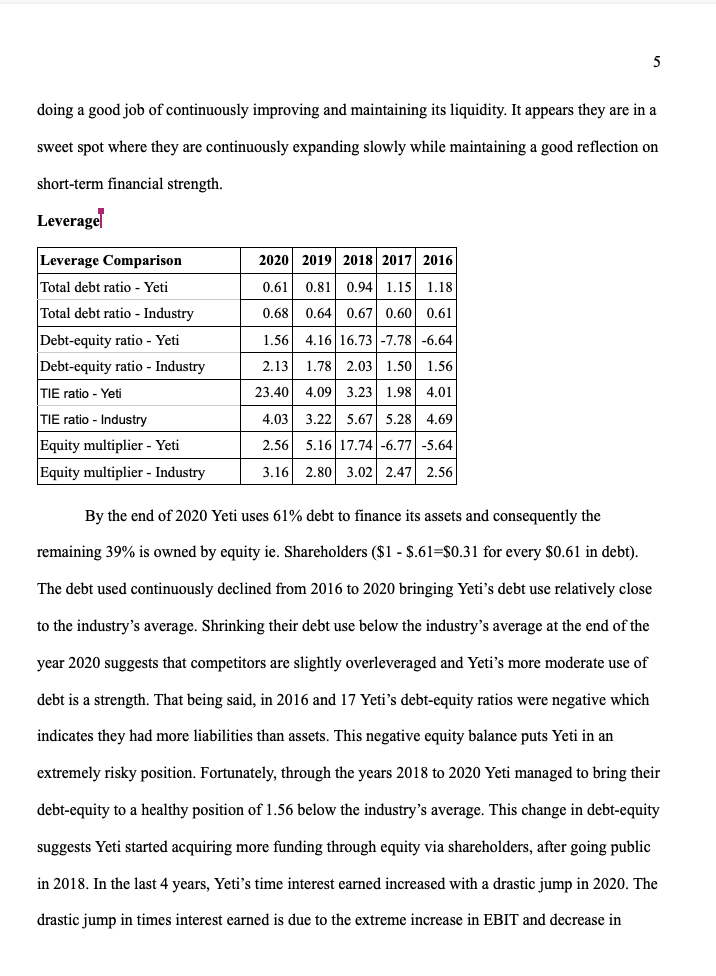
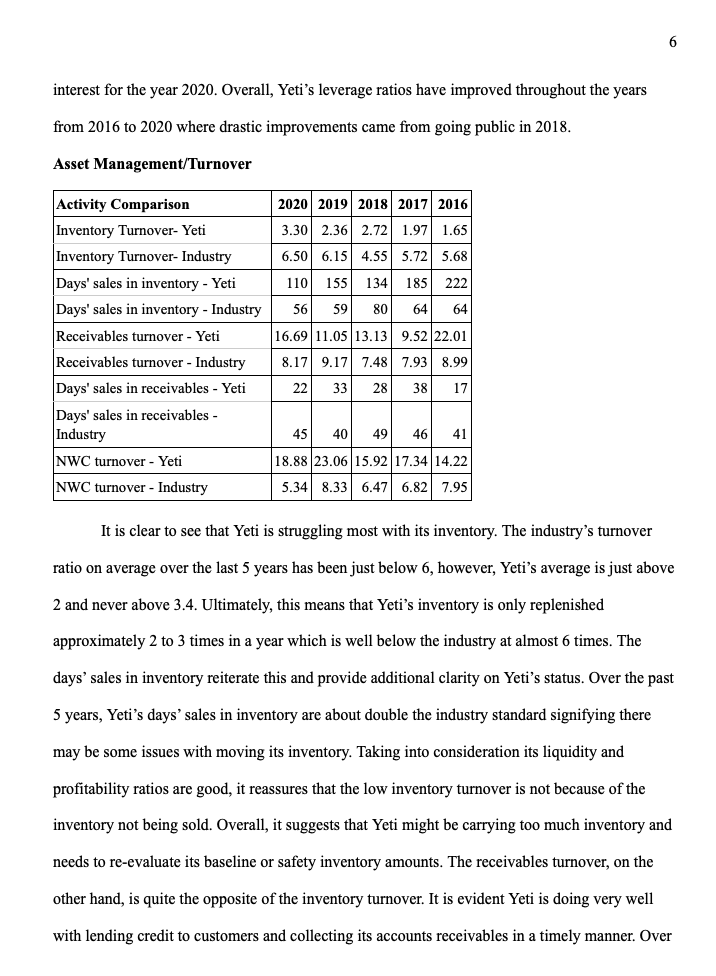
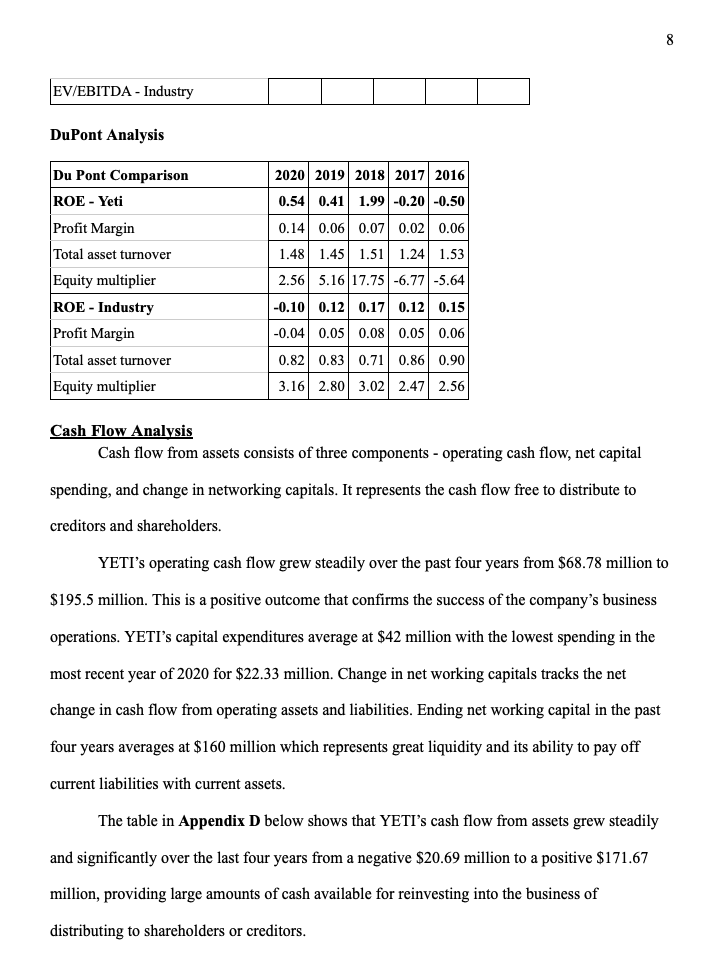
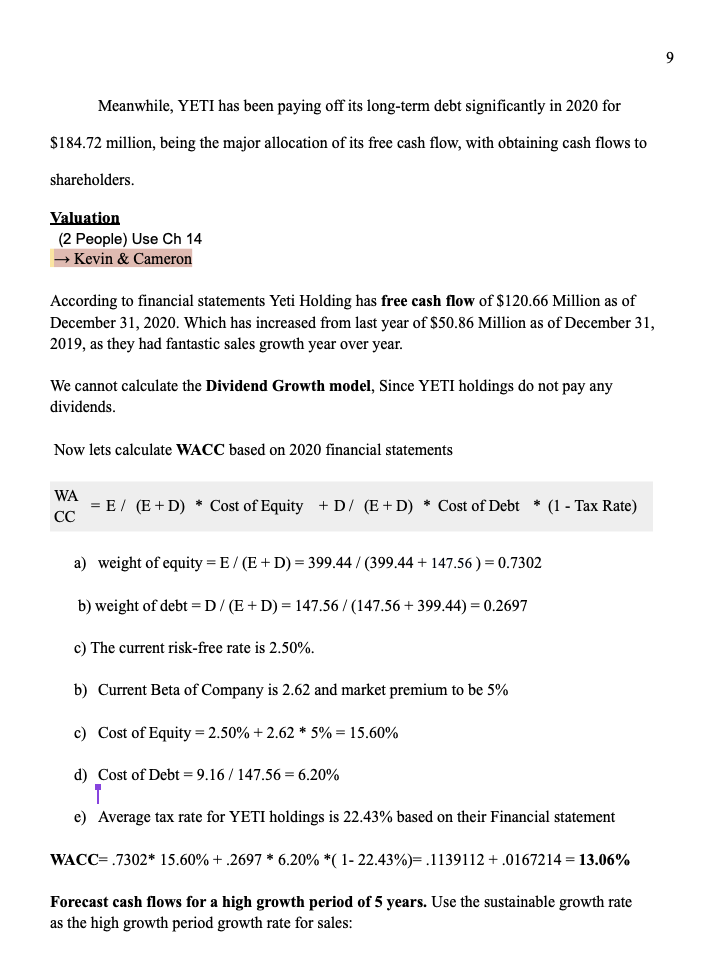
3 Introduction YETI was founded in 2006 by two brothers who saw a need for the outdoor lifestyle. Roy and Ryan Seiders started building on a dream and set out to create a cooler that could stand up to the rigorous elements of their outdoor hunting and fishing excursions. In a 2014 interview with Austin American-Statesman, Roy described them as being a ...cheap disposable product that fell apart after a few uses." (Dutchland Plastics, 2018). Their focus was not on creating a product that could quickly bring in profit in retail markets, but instead, they targeted the outdoorsmen who were serious about this lifestyle. The company to everyone's surprise has grown tremendously and is now a top seller for outdoor products. Their critiques say their products are overpriced but every year they receive more profit and gain more loyal customers because of the movement and lifestyle they embody and promote. (Leighton, 2018). Company Background Since their early years, Roy and Ryan always had a passion for the outdoors. Being raised with an appreciation for wildlife, and durable gear they could take on their excursions, the two brothers became unsatisfied with the lack of strong, durable coolers in the marketplace. Their focus was not on creating a product that could quickly bring in profit in retail markets, but instead, they targeted the outdoorsmen who were serious about this lifestyle. The company to everyone's surprise has grown tremendously and is now a top seller for outdoor products. Their critics say their products are overpriced but every year they receive more profit and gain more loyal customers because of the movement and lifestyle they embody and promote. Company and Industry Analysis , e.g., Porter 5 forces model, SWOT/PESTLE, company management/governance, etc. Chelsea 4 Financial Analysis Lorene and Wendy Liquidity Liquidity Comparison Current Ratio - Yeti 2020 2019 2018 2017 2016 1.66 2.12 1.59 1.99 2.40 2.00 1.73 1.65 1.72 1.74 Current Ratio - Industry Quick Ratio - Yeti 1.17 1.03 0.81 0.84 0.62 1.41 1.00 0.97 1.10 0.99 Quick Ratio - Industry Cash Ratio - Yeti Cash Ratio - Industry 0.88 0.43 0.43 0.35 0.15 1.04 0.51 0.40 0.33 0.24 Overall, Yeti has had good liquidity strength and is right in line with the industry averages. The current ratio has fluctuated up and down over the last 5 years but remains relatively consistent and always above 1.5. A current ratio above 1 means that its current assets can cover all curr abili However, being in the manufacturing industry, the current ratio can be inflated due to the demand to carry higher inventory volumes. The quick ratio is a better indicator of the actual liquidity in the manufacturing sector. Yeti's quick ratio has become increasingly stronger over the last 5 years and is a good indicator that Yeti is in a better position now than the previous 4 years with an ending quick ratio of over 1. This means that, when the inventory is removed from current assets as it is the least liquid asset, the company is still able to cover all its current liabilities and not rely on slow-moving inventory sales to cover some portion of its current liabilities. Over the last 3 years, Yeti's quick ratio is on par with the industry but in previous years, fell short. The cash ratio has followed the same trend as the quick ratio and has become increasingly better in most recent years. This trend falls right in line with the industry average; however, Yeti comes up a bit short in 2020. That being said, the cash ratio is still pretty good as it is interpreted that for every $1 in current liabilities, Yeti can cover $0.88 solely with cash or cash equivalents leaving $0.12 to be covered by other current assets such as A/R. Yeti is 5 doing a good job of continuously improving and maintaining its liquidity. It appears they are in a sweet spot where they are continuously expanding slowly while maintaining a good reflection on short-term financial strength. Leveragel 2020 2019 2018 2017 2016 0.61 0.81 0.94 1.15 1.18 0.68 0.64 0.67 0.60 0.61 Leverage Comparison Total debt ratio - Yeti Total debt ratio - Industry Debt-equity ratio - Yeti Debt-equity ratio - Industry TIE ratio - Yeti 1.56 4.16 16.73 -7.78 -6.64 2.13 1.78 2.03 1.50 1.56 23.40 4.09 3.23 1.98 4.01 TIE ratio - Industry 4.03 3.22 5.67 5.28 4.69 2.56 5.16 17.74 -6.77-5.64 Equity multiplier - Yeti Equity multiplier - Industry 3.16 2.80 3.02 2.47 2.56 By the end of 2020 Yeti uses 61% debt to finance its assets and consequently the remaining 39% is owned by equity ie. Shareholders ($1 - $.61=$0.31 for every $0.61 in debt). The debt used continuously declined from 2016 to 2020 bringing Yeti's debt use relatively close to the industry's average. Shrinking their debt use below the industry's average at the end of the year 2020 suggests that competitors are slightly overleveraged and Yeti's more moderate use of debt is a strength. That being said, in 2016 and 17 Yeti's debt-equity ratios were negative which indicates they had more liabilities than assets. This negative equity balance puts Yeti in an extremely risky position. Fortunately, through the years 2018 to 2020 Yeti managed to bring their debt-equity to a healthy position of 1.56 below the industry's average. This change in debt-equity suggests Yeti started acquiring more funding through equity via shareholders, after going public in 2018. In the last 4 years, Yeti's time interest earned increased with a drastic jump in 2020. The drastic jump in times interest earned is due to the extreme increase in EBIT and decrease in 6 interest for the year 2020. Overall, Yeti's leverage ratios have improved throughout the years from 2016 to 2020 where drastic improvements came from going public in 2018. Asset Management/Turnover 2020 2019 2018 2017 2016 3.30 2.36 2.72 1.97 1.65 6.50 6.15 4.55 5.72 5.68 110 155 134 185 222 56 59 80 64 64 16.69 11.05 13.13 9.52 22.01 Activity Comparison Inventory Turnover-Yeti Inventory Turnover- Industry Days' sales in inventory - Yeti Days' sales in inventory - Industry Receivables turnover - Yeti Receivables turnover - Industry Days' sales in receivables - Yeti Days' sales in receivables - Industry NWC turnover - Yeti NWC turnover - Industry 8.17 9.17 7.48 7.93 8.99 22 33 28 38 17 45 40 49 46 41 18.88 23.06 15.92 17.34 14.22 5.34 8.33 6.47 6.82 7.95 It is clear to see that Yeti is struggling most with its inventory. The industry's turnover ratio on average over the last 5 years has been just below 6, however, Yeti's average is just above 2 and never above 3.4. Ultimately, this means that Yeti's inventory is only replenished approximately 2 to 3 times in a year which is well below the industry at almost 6 times. The days' sales in inventory reiterate this and provide additional clarity on Yeti's status. Over the past 5 years, Yeti's days' sales in inventory are about double the industry standard signifying there may be some issues with moving its inventory. Taking into consideration its liquidity and profitability ratios are good, it reassures that the low inventory turnover is not because of the inventory not being sold. Overall, it suggests that Yeti might be carrying too much inventory and needs to re-evaluate its baseline or safety inventory amounts. The receivables turnover, on the other hand, is quite the opposite of the inventory turnover. It is evident Yeti is doing very well with lending credit to customers and collecting its accounts receivables in a timely manner. Over 7 the past 5 years on average, Yeti has had a receivables turnover of 14.5 times, meaning they have lent out the same credit and collected it 14.5 times over one year. Accordingly, its days' sales in receivables over the past 5 years has ranged from 17 38 days which is very good. This indicates that Yeti has the cash flow available to turn around and pay its creditors on a monthly basis. Yeti is well above the industry average when it comes to receivables, indicating superior collection strength and excellent customers. Lastly, the NWC turnover remains very strong and well above the industry benchmark. On average, for every $1 in net working capital, Yeti generates $18 in revenue, compared to the industry standard of $1 in net working capital, generating $7 in revenue. We can conclude that Yeti is very efficient at generating revenue per dollar of cash available to spend on operations and is far superior in doing so, in comparison to the industry benchmark. Profitability 2020 2019 2018 2017 2016 0.14 0.06 0.07 0.02 0.06 Profitability Comparison Profit margin - Yeti Profit margin - Industry ROA - Yeti ROA - Industry -0.04 0.05 0.08 0.05 0.06 0.21 0.08 0.11 0.03 0.09 -0.03 0.04 0.06 0.05 0.06 0.54 0.41 1.99 -0.20 -0.50 ROE - Yeti ROE - Industry -0.10 0.12 0.17 0.12 0.15 Market Value Market Value Comparison 2020 2019 2018 2017 2016 P/E - Yeti P/E - Industry Market to Book - Yeti Market to Book - Industry EV/EBITDA - Yeti 8 EV/EBITDA - Industry DuPont Analysis 2020 2019 2018 2017 2016 Du Pont Comparison ROE - Yeti 0.54 0.41 1.99 -0.20 -0.50 0.14 0.06 0.07 0.02 0.06 1.48 1.45 1.51 1.24 1.53 Profit Margin Total asset turnover Equity multiplier ROE - Industry Profit Margin 2.56 5.16 17.75 -6.77-5.64 -0.10 0.12 0.17 0.12 0.15 -0.04 0.05 0.08 0.05 0.06 Total asset turnover 0.82 0.83 0.71 0.86 0.90 3.16 2.80 3.02 2.47 2.56 Equity multiplier Cash Flow Analysis Cash flow from assets consists of three components - operating cash flow, net capital spending, and change in networking capitals. It represents the cash flow free to distribute to creditors and shareholders. YETI's operating cash flow grew steadily over the past four years from $68.78 million to $195.5 million. This is a positive outcome that confirms the success of the company's business operations. YETI's capital expenditures average at $42 million with the lowest spending in the most recent year of 2020 for $22.33 million. Change in net working capitals tracks the net change in cash flow from operating assets and liabilities. Ending net working capital in the past four years averages at $160 million which represents great liquidity and its ability to pay off current liabilities with current assets. The table in Appendix D below shows that YETI's cash flow from assets grew steadily and significantly over the last four years from a negative $20.69 million to a positive $171.67 million, providing large amounts of cash available for reinvesting into the business of distributing to shareholders or creditors. 9 Meanwhile, YETI has been paying off its long-term debt significantly in 2020 for $184.72 million, being the major allocation of its free cash flow, with obtaining cash flows to shareholders. Valuation (2 People) Use Ch 14 Kevin & Cameron According to financial statements Yeti Holding has free cash flow of $120.66 Million as of December 31, 2020. Which has increased from last year of $50.86 Million as of December 31, 2019, as they had fantastic sales growth year over year. We cannot calculate the Dividend Growth model, Since YETI holdings do not pay any dividends. Now lets calculate WACC based on 2020 financial statements WA = E / (E+D) * Cost of Equity +D/ (E+D) * Cost of Debt * (1 - Tax Rate) a) weight of equity = E/(E+D) = 399.44 / (399.44 + 147.56 ) = 0.7302 b) weight of debt =D/(E+D) = 147.56/(147.56 + 399.44) = 0.2697 c) The current risk-free rate is 2.50%. b) Current Beta of Company is 2.62 and market premium to be 5% c) Cost of Equity = 2.50% + 2.62 * 5% = 15.60% d) Cost of Debt = 9.16 / 147.56 = 6.20% e) Average tax rate for YETI holdings is 22.43% based on their Financial statement WACC=.7302* 15.60% +.2697 * 6.20% *(1- 22.43%= .1139112 +.0167214 = 13.06% Forecast cash flows for a high growth period of 5 years. Use the sustainable growth rate as the high growth period growth rate for sales: 10 Discounted Cash Flow (DCF) assuming 3% sales growth in forever: calculation in Appendix F. Recommendation From the above data, we can see that Yeti is worth recommending to invest. Brand influence, customer intimacy, and significant sales growth are all reasons why customers choose, and then we will prove them through data and examples. Brilliant branding Yeti Holdings is known to have been founded by two outdoor brothers who were dissatisfied with the coolers on the market. They decided to create a product that would essentially keep their items cold for hours. This is to say, Yeti is primarily a company known for its coolers, outdoor accessories and appliances. "Designed to handle the paces of a rugged life in the wild and still keep ice for days" is their design philosophy. Many people may ask why the smaller hard cooler retails for $250, and how this company can sell its product at such a high price. We strongly believe this is due to Yeti's excellent branding and effective marketing. Yeti hired Calvin Klein's former global chief marketing officer in 2019 and created a brand that will differentiate anyone interested in outdoor recreation. These coolers have become a status symbol for outdoorsmen across the country. Overall, the company's knack for marketing its products is a big reason why this stock can be a great addition to your portfolio. Customer intimacy If a company has closeness to its customers, it's certainly a holding to trust. What can be seen is a huge increase in the company's direct-to-consumer sales. Here it has to be said that companies wisely use DTC strategies to connect and engage with customers on a deeper level, and to create loyal repeat customers through direct-to-consumer sales. The benefit of this is that 11 businesses can control the entire customer experience, eliminating the need to rely on third-party vendors. Direct-to-consumer channel net sales rose 59% to $126.8 million, according to Yeti's first-quarter earnings reported in 2021. Such huge sales confirm that the strategy is gaining traction. Moreover, the company's DTC channel also grew to 51% of net sales and helped deliver a 42% first-quarter net sales growth. In a word, direct-to-consumer sales channels are an advantage because they help improve profit margins because companies don't have to pay retailers to sell their products. Significant sales growth Of course, the more important factor on whether investors should be advised to buy or benefit from a company is the company's data, including ratio, earnings, and so on. When it comes to the data of Yeti Holding's, we have mentioned it in the company's financial analysis, and then we will analyze some of the data in detail to provide investors with a better picture. Current ratio We all know that a good company should have a good current ratio between 1.2 and 2, which means the company has 2 times more current assets than its liabilities to service its debts, whereas a current ratio below 1 means the company has no sufficient current assets to cover its short-term liabilities. Yeti's current ratio was above 1.5 from 2016 to 2020, at least 1.59 in 2018. The above data provides investors with information that Yeti can maximize its current assets on its balance sheet to meet its current liabilities and other payables. Quick ratio 12 In recent years, Yeti Holdings has had a quick ratio of around 1%, which is considered a healthy quick ratio. This data provides investors that the company is fully equipped with sufficient assets to be liquidated immediately to cover its current liabilities. Cash flow When it comes to Yeti's cash ratio, we can see that it was lower than 0.5 between 2016 and 2019, and doubled in 2020 compared to 2019. Such rapid growth tells investors the value of a company's current assets that can be quickly turned into cash and the percentage that these cash and near-cash assets can cover a company's current liabilities. Profit margin We all know that net profit margins help investors assess whether a company's management is generating enough profit from its sales and whether operating and overhead costs are under control. The profit margin according to Yeti has been higher than the industry in recent years. That is to say, investors can rest assured that the company's profit-making, and thus long-term holding ROE ROE is arguably the most important factor for investors to measure a company, as it is a financial ratio that tells investors how much net income the company generates per $1 of capital invested. That said, this percentage is critical because it helps investors understand how efficiently a company is using its capital to generate profits. Since 2018, Yeti's ROE has generally been higher than the market. Although the market fell to -0.10 in 2020 due to various factors, Yeti is still higher than the market at 0.64 with a value of 0.54. 13 The above data are all relevant before investors invest. Yeti's excellent marketing methods, brand benefits, and various data higher than the industry have conveyed a message to investors that Yeti is worth investing in. Conclusion >Pengzhan yang As a company mainly focusing on outdoor sports equipment, Yeti Holding is undoubtedly worthy of being known by more people. As we mentioned in this paper, even though a small cooler can be sold for $250, it still sells so much. It is because of Yeti's excellent promotional methods and marketing strategies for products. Based on these, coupled with the hard power of the product itself, many customers are deeply loved. Of course, for investors, the company's financial capabilities or market influence is more important. From the table provided in the paper, it can be seen that Yeti has significantly improved in 2019-2020 compared to the previous period, both in terms of profitability and its operations. So both customers and investors can find what they need in Yeti. In a word, Yeti's affinity for consumers and giving investors enough reason to believe is what makes them successfulStep by Step Solution
There are 3 Steps involved in it
Step: 1

Get Instant Access to Expert-Tailored Solutions
See step-by-step solutions with expert insights and AI powered tools for academic success
Step: 2

Step: 3
Ace Your Homework with AI
Get the answers you need in no time with our AI-driven, step-by-step assistance
Get Started
Mein Ultimativer Weihnachts Planer
Authors: Zizo Nimane
1st Edition
B0CM2J8GTG