

Question: Please write a summary of this project in a paragraph. And also write a conclusion of the whole project in one paragraph as well. Texas
Please write a summary of this project in a paragraph. And also write a conclusion of the whole project in one paragraph as well.
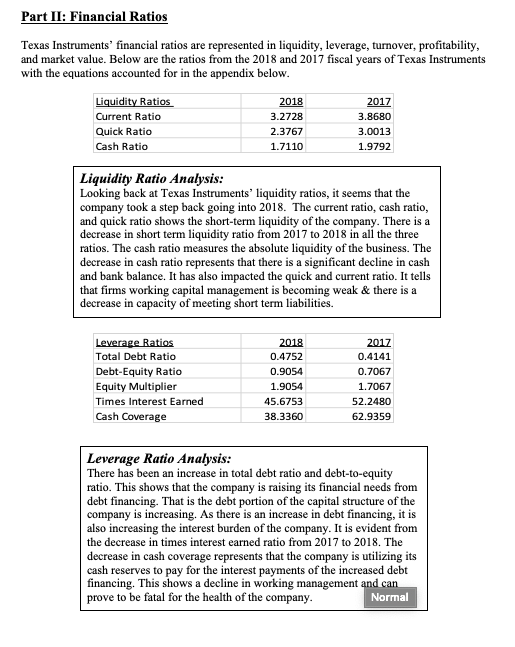
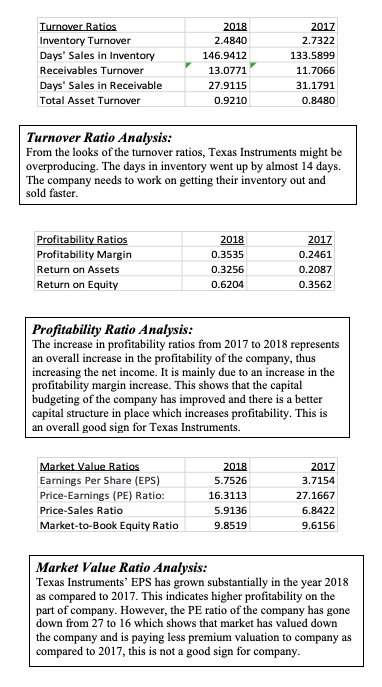
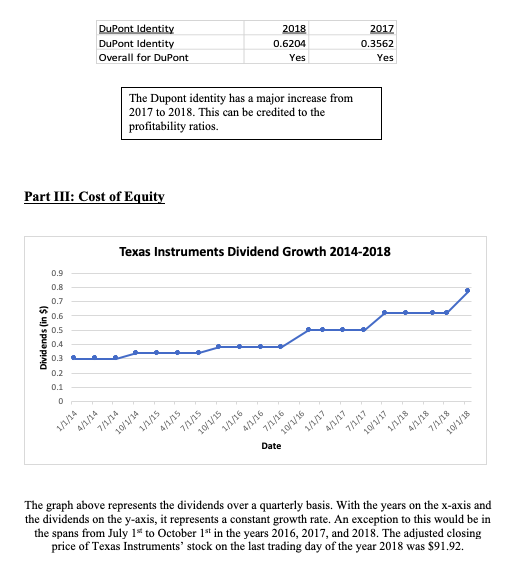
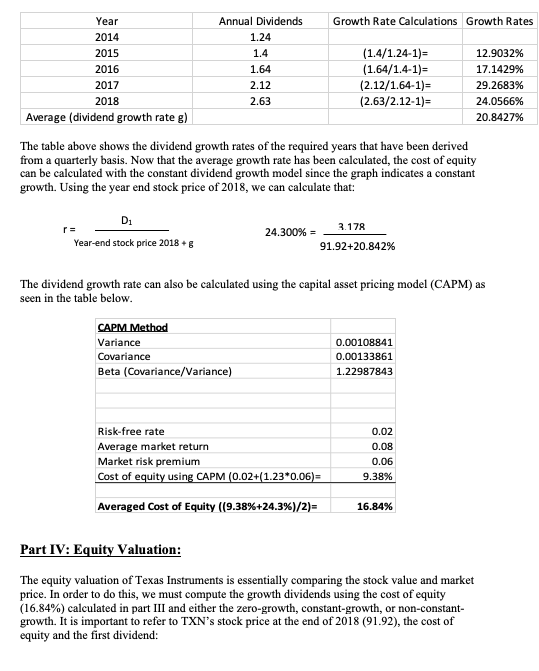
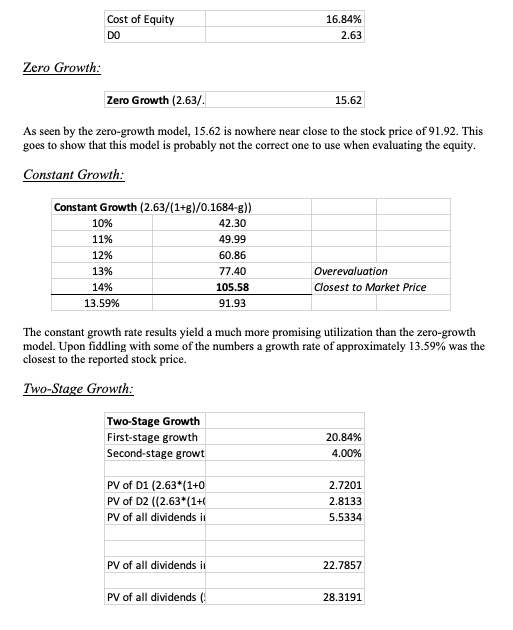
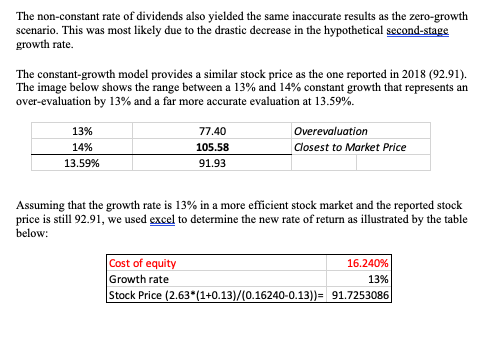
Texas Instruments INC. Part I: Company Description Brief History Texas Instruments, also known as TI, is widely known to many around the world, especially to students, as an overpriced calculator company. Little do most people know, they are one of the world's largest manufactures of semiconductors and circuits. In 1930, Texas Instruments was founded, but not as a technology company, but as an oil and gas company. The original name of the company was "Geophysical Service" and was later renamed to Texas Instruments in 1951. Throughout the company's years of success, Texas Instruments has changed and reinvented their company to keep up with the times of the markets. The company currently lead by President and CEO Richard K. Templeton. Taxas Inctruments is incorporated in Delaware and is headquartered in Dallas, TX and has 30 of Normal d 18 countries (Texas is Instruments 10-K). Business Strategy Texas Instruments' business strategy is designed around four sustainable competitive advantages. These advantages include a strong foundation of manufacturing and technology, a broad portfolio of differentiated analog and embedded processing products, the broadest reach of market channels, and diversity and longevity of our products, markets, and customer positions (Texas Instruments 10-K). Texas Instruments focuses its priority on producing the best products they can. Competition and Risk Factors Texas Instruments has many competitors in the semiconductor market. Some of those competitors being the likes of Casio Computer, Microchip Technology, and Microsemi. All of these companies produce semiconductors and circuits for manufacturing and industrial business. With this being said, Texas Instruments dominates the semiconductor business by almost $5 billion more than the leading company, NXP Semiconductors (Craft). Some risk factors that Texas Instruments face are rapid technological changes in the market, warranty claims, and product liability. Part II: Financial Ratios Texas Instruments' financial ratios are represented in liquidity, leverage, turnover, profitability, and market value. Below are the ratios from the 2018 and 2017 fiscal years of Texas Instruments with the equations accounted for in the appendix below. Liquidity Ratios 2018 2017 Current Ratio 3.2728 3.8680 2.3767 Quick Ratio 3.0013 Cash Ratio 1.7110 1.9792 Liquidity Ratio Analysis: Looking back at Texas Instruments' liquidity ratios, it seems that the company took a step back going into 2018. The current ratio, cash ratio, and quick ratio shows the short-term liquidity of the company. There is a decrease in short term liquidity ratio from 2017 to 2018 in all the three ratios. The cash ratio measures the absolute liquidity of the business. The decrease in cash ratio represents that there is a significant decline in cash and bank balance. It has also impacted the quick and current ratio. It tells that firms working capital management is becoming weak & there is a decrease in capacity of meeting short term liabilities. Leverage Ratios 2018 2017 Total Debt Ratio 0.4752 0.4141 Debt-Equity Ratio Equity Multiplier 0.9054 0.7067 1.9054 1.7067 Times Interest Earned 45.6753 52.2480 Cash Coverage 38.3360 62.9359 Leverage Ratio Analysis: There has been an increase in total debt ratio and debt-to-equity ratio. This shows that the company is raising its financial needs from debt financing. That is the debt portion of the capital structure of the company is increasing. As there is an increase in debt financing, it is also increasing the interest burden of the company. It is evident from the decrease in times interest earned ratio from 2017 to 2018. The decrease in cash coverage represents that the company is utilizing its cash reserves to pay for the interest payments of the increased debt financing. This shows a decline in working management and can prove to be fatal for the health of the company. Normal Turnover Ratios Inventory Turnover Days' Sales in Inventory 2018 2017 2.4840 2.7322 146.9412 133.5899 Receivables Turnover 13.0771 11.7066 Days' Sales in Receivable 27.9115 31.1791 Total Asset Turnover 0.9210 0.8480 Turnover Ratio Analysis: From the looks of the turnover ratios, Texas Instruments might be overproducing. The days in inventory went up by almost 14 days. The company needs to work on getting their inventory out and sold faster. Profitability Ratios Profitability Margin 2017 2018 0.3535 0.2461 Return on Assets 0.3256 0.2087 Return on Equity 0.6204 0.3562 Profitability Ratio Analysis: The increase in profitability ratios from 2017 to 2018 represents an overall increase in the profitability of the company, thus increasing the net income. It is mainly due to an increase in the profitability margin increase. This shows that the capital budgeting of the company has improved and there is a better capital structure in place which increases profitability. This is an overall good sign for Texas Instruments. Market Value Ratios 2018 2017 Earnings Per Share (EPS) Price-Earnings (PE) Ratio: 5.7526 3.7154 16.3113 27.1667 Price-Sales Ratio 5.9136 6.8422 Market-to-Book Equity Ratio 9.8519 9.6156 Market Value Ratio Analysis: Texas Instruments' EPS has grown substantially in the year 2018 as compared to 2017. This indicates higher profitability on the part of company. However, the PE ratio of the company has gone down from 27 to 16 which shows that market has valued down the company and is paying less premium valuation to company as compared to 2017, this is not a good sign for company. DuPont Identity DuPont Identity 2018 Overall for DuPont 2017 0.6204 0.3562 Yes Yes The Dupont identity has a major increase from 2017 to 2018. This can be credited to the profitability ratios. Part III: Cost of Equity Texas Instruments Dividend Growth 2014-2018 0.9 0.8 0.7 0.6 0.5 0.4 0.3 0.2 0.1 7/1/15 10/1/15 7/1/14 7/1/18 10/1/18 10/1/17 The graph above represents the dividends over a quarterly basis. With the years on the x-axis and the dividends on the y-axis, it represents a constant growth rate. An exception to this would be in the spans from July 1* to October 1st in the years 2016, 2017, and 2018. The adjusted closing price of Texas Instruments' stock on the last trading day of the year 2018 was $91.92. Dividends (in $) 1/1/14 4/1/14 10/1/14 115 4/1/15 1/1/16 4/1/16 7/1/16 10/1/16 1/1/17 47 7/1/17 1/1/18 4/1/18 Year Annual Dividends Growth Rate Calculations Growth Rates 2014 1.24 (1.4/1.24-1)= (1.64/1.4-1)= (2.12/1.64-1)= (2.63/2.12-1)= 2015 1.4 12.9032% 2016 1.64 17.1429% 2017 2.12 29.2683% 2.63 2018 24.0566% Average (dividend growth rate g) 20.8427% The table above shows the dividend growth rates of the required years that have been derived from a quarterly basis. Now that the average growth rate has been calculated, the cost of equity can be calculated with the constant dividend growth model since the graph indicates a constant growth. Using the year end stock price of 2018, we can calculate that: D: 3.178 24.300% = Year-end stock price 2018 + g 91.92+20.842% The dividend growth rate can also be calculated using the capital asset pricing model (CAPM) as seen in the table below. CAPM Method Variance 0.00108841 Covariance 0.00133861 Beta (Covariance/Variance) 1.22987843 Risk-free rate 0.02 Average market return Market risk premium Cost of equity using CAPM (0.02+(1.23*0.06)= 0.08 0.06 9.38% Averaged Cost of Equity ((9.38%+24.3%)/2)= 16.84% Part IV: Equity Valuation: The equity valuation of Texas Instruments is essentially comparing the stock value and market price. In order to do this, we must compute the growth dividends using the cost of equity (16.84%) calculated in part III and either the zero-growth, constant-growth, or non-constant- growth. It is important to refer to TXN's stock price at the end of 2018 (91.92), the cost of equity and the first dividend: Cost of Equity 16.84% DO 2.63 Zero Growth: Zero Growth (2.63/. 15.62 As seen by the zero-growth model, 15.62 is nowhere near close to the stock price of 91.92. This goes to show that this model is probably not the correct one to use when evaluating the equity. Constant Growth: Constant Growth (2.63/(1+g)/0.1684-g)) 42.30 10% 11% 49.99 12% 60.86 13% 77.40 Overevaluation 14% 105.58 Closest to Market Price 13.59% 91.93 The constant growth rate results yield a much more promising utilization than the zero-growth model. Upon fiddling with some of the numbers a growth rate of approximately 13.59% was the closest to the reported stock price. Two-Stage Growth: Two-Stage Growth First-stage growth 20.84% Second-stage growt 4.00% PV of D1 (2.63*(1+0 PV of D2 ((2.63*(1+ PV of all dividends i 2.7201 2.8133 5.5334 PV of all dividends i 22.7857 PV of all dividends (! 28.3191 The non-constant rate of dividends also yielded the same inaccurate results as the zero-growth scenario. This was most likely due to the drastic decrease in the hypothetical second-stage growth rate. The constant-growth model provides a similar stock price as the one reported in 2018 (92.91). The image below shows the range between a 13% and 14% constant growth that represents an over-evaluation by 13% and a far more accurate evaluation at 13.59%. 13% 77.40 Overevaluation 14% 105.58 Closest to Market Price 13.59% 91.93 Assuming that the growth rate is 13% in a more efficient stock market and the reported stock price is still 92.91, we used excel to determine the new rate of return as illustrated by the table below: Cost of equity Growth rate Stock Price (2.63 (1+0.13)/(0.16240-0.13))= 16.240% 13% 91.7253086 Texas Instruments INC. Part I: Company Description Brief History Texas Instruments, also known as TI, is widely known to many around the world, especially to students, as an overpriced calculator company. Little do most people know, they are one of the world's largest manufactures of semiconductors and circuits. In 1930, Texas Instruments was founded, but not as a technology company, but as an oil and gas company. The original name of the company was "Geophysical Service" and was later renamed to Texas Instruments in 1951. Throughout the company's years of success, Texas Instruments has changed and reinvented their company to keep up with the times of the markets. The company currently lead by President and CEO Richard K. Templeton. Taxas Inctruments is incorporated in Delaware and is headquartered in Dallas, TX and has 30 of Normal d 18 countries (Texas is Instruments 10-K). Business Strategy Texas Instruments' business strategy is designed around four sustainable competitive advantages. These advantages include a strong foundation of manufacturing and technology, a broad portfolio of differentiated analog and embedded processing products, the broadest reach of market channels, and diversity and longevity of our products, markets, and customer positions (Texas Instruments 10-K). Texas Instruments focuses its priority on producing the best products they can. Competition and Risk Factors Texas Instruments has many competitors in the semiconductor market. Some of those competitors being the likes of Casio Computer, Microchip Technology, and Microsemi. All of these companies produce semiconductors and circuits for manufacturing and industrial business. With this being said, Texas Instruments dominates the semiconductor business by almost $5 billion more than the leading company, NXP Semiconductors (Craft). Some risk factors that Texas Instruments face are rapid technological changes in the market, warranty claims, and product liability. Part II: Financial Ratios Texas Instruments' financial ratios are represented in liquidity, leverage, turnover, profitability, and market value. Below are the ratios from the 2018 and 2017 fiscal years of Texas Instruments with the equations accounted for in the appendix below. Liquidity Ratios 2018 2017 Current Ratio 3.2728 3.8680 2.3767 Quick Ratio 3.0013 Cash Ratio 1.7110 1.9792 Liquidity Ratio Analysis: Looking back at Texas Instruments' liquidity ratios, it seems that the company took a step back going into 2018. The current ratio, cash ratio, and quick ratio shows the short-term liquidity of the company. There is a decrease in short term liquidity ratio from 2017 to 2018 in all the three ratios. The cash ratio measures the absolute liquidity of the business. The decrease in cash ratio represents that there is a significant decline in cash and bank balance. It has also impacted the quick and current ratio. It tells that firms working capital management is becoming weak & there is a decrease in capacity of meeting short term liabilities. Leverage Ratios 2018 2017 Total Debt Ratio 0.4752 0.4141 Debt-Equity Ratio Equity Multiplier 0.9054 0.7067 1.9054 1.7067 Times Interest Earned 45.6753 52.2480 Cash Coverage 38.3360 62.9359 Leverage Ratio Analysis: There has been an increase in total debt ratio and debt-to-equity ratio. This shows that the company is raising its financial needs from debt financing. That is the debt portion of the capital structure of the company is increasing. As there is an increase in debt financing, it is also increasing the interest burden of the company. It is evident from the decrease in times interest earned ratio from 2017 to 2018. The decrease in cash coverage represents that the company is utilizing its cash reserves to pay for the interest payments of the increased debt financing. This shows a decline in working management and can prove to be fatal for the health of the company. Normal Turnover Ratios Inventory Turnover Days' Sales in Inventory 2018 2017 2.4840 2.7322 146.9412 133.5899 Receivables Turnover 13.0771 11.7066 Days' Sales in Receivable 27.9115 31.1791 Total Asset Turnover 0.9210 0.8480 Turnover Ratio Analysis: From the looks of the turnover ratios, Texas Instruments might be overproducing. The days in inventory went up by almost 14 days. The company needs to work on getting their inventory out and sold faster. Profitability Ratios Profitability Margin 2017 2018 0.3535 0.2461 Return on Assets 0.3256 0.2087 Return on Equity 0.6204 0.3562 Profitability Ratio Analysis: The increase in profitability ratios from 2017 to 2018 represents an overall increase in the profitability of the company, thus increasing the net income. It is mainly due to an increase in the profitability margin increase. This shows that the capital budgeting of the company has improved and there is a better capital structure in place which increases profitability. This is an overall good sign for Texas Instruments. Market Value Ratios 2018 2017 Earnings Per Share (EPS) Price-Earnings (PE) Ratio: 5.7526 3.7154 16.3113 27.1667 Price-Sales Ratio 5.9136 6.8422 Market-to-Book Equity Ratio 9.8519 9.6156 Market Value Ratio Analysis: Texas Instruments' EPS has grown substantially in the year 2018 as compared to 2017. This indicates higher profitability on the part of company. However, the PE ratio of the company has gone down from 27 to 16 which shows that market has valued down the company and is paying less premium valuation to company as compared to 2017, this is not a good sign for company. DuPont Identity DuPont Identity 2018 Overall for DuPont 2017 0.6204 0.3562 Yes Yes The Dupont identity has a major increase from 2017 to 2018. This can be credited to the profitability ratios. Part III: Cost of Equity Texas Instruments Dividend Growth 2014-2018 0.9 0.8 0.7 0.6 0.5 0.4 0.3 0.2 0.1 7/1/15 10/1/15 7/1/14 7/1/18 10/1/18 10/1/17 The graph above represents the dividends over a quarterly basis. With the years on the x-axis and the dividends on the y-axis, it represents a constant growth rate. An exception to this would be in the spans from July 1* to October 1st in the years 2016, 2017, and 2018. The adjusted closing price of Texas Instruments' stock on the last trading day of the year 2018 was $91.92. Dividends (in $) 1/1/14 4/1/14 10/1/14 115 4/1/15 1/1/16 4/1/16 7/1/16 10/1/16 1/1/17 47 7/1/17 1/1/18 4/1/18 Year Annual Dividends Growth Rate Calculations Growth Rates 2014 1.24 (1.4/1.24-1)= (1.64/1.4-1)= (2.12/1.64-1)= (2.63/2.12-1)= 2015 1.4 12.9032% 2016 1.64 17.1429% 2017 2.12 29.2683% 2.63 2018 24.0566% Average (dividend growth rate g) 20.8427% The table above shows the dividend growth rates of the required years that have been derived from a quarterly basis. Now that the average growth rate has been calculated, the cost of equity can be calculated with the constant dividend growth model since the graph indicates a constant growth. Using the year end stock price of 2018, we can calculate that: D: 3.178 24.300% = Year-end stock price 2018 + g 91.92+20.842% The dividend growth rate can also be calculated using the capital asset pricing model (CAPM) as seen in the table below. CAPM Method Variance 0.00108841 Covariance 0.00133861 Beta (Covariance/Variance) 1.22987843 Risk-free rate 0.02 Average market return Market risk premium Cost of equity using CAPM (0.02+(1.23*0.06)= 0.08 0.06 9.38% Averaged Cost of Equity ((9.38%+24.3%)/2)= 16.84% Part IV: Equity Valuation: The equity valuation of Texas Instruments is essentially comparing the stock value and market price. In order to do this, we must compute the growth dividends using the cost of equity (16.84%) calculated in part III and either the zero-growth, constant-growth, or non-constant- growth. It is important to refer to TXN's stock price at the end of 2018 (91.92), the cost of equity and the first dividend: Cost of Equity 16.84% DO 2.63 Zero Growth: Zero Growth (2.63/. 15.62 As seen by the zero-growth model, 15.62 is nowhere near close to the stock price of 91.92. This goes to show that this model is probably not the correct one to use when evaluating the equity. Constant Growth: Constant Growth (2.63/(1+g)/0.1684-g)) 42.30 10% 11% 49.99 12% 60.86 13% 77.40 Overevaluation 14% 105.58 Closest to Market Price 13.59% 91.93 The constant growth rate results yield a much more promising utilization than the zero-growth model. Upon fiddling with some of the numbers a growth rate of approximately 13.59% was the closest to the reported stock price. Two-Stage Growth: Two-Stage Growth First-stage growth 20.84% Second-stage growt 4.00% PV of D1 (2.63*(1+0 PV of D2 ((2.63*(1+ PV of all dividends i 2.7201 2.8133 5.5334 PV of all dividends i 22.7857 PV of all dividends (! 28.3191 The non-constant rate of dividends also yielded the same inaccurate results as the zero-growth scenario. This was most likely due to the drastic decrease in the hypothetical second-stage growth rate. The constant-growth model provides a similar stock price as the one reported in 2018 (92.91). The image below shows the range between a 13% and 14% constant growth that represents an over-evaluation by 13% and a far more accurate evaluation at 13.59%. 13% 77.40 Overevaluation 14% 105.58 Closest to Market Price 13.59% 91.93 Assuming that the growth rate is 13% in a more efficient stock market and the reported stock price is still 92.91, we used excel to determine the new rate of return as illustrated by the table below: Cost of equity Growth rate Stock Price (2.63 (1+0.13)/(0.16240-0.13))= 16.240% 13% 91.7253086
Step by Step Solution
There are 3 Steps involved in it

Get step-by-step solutions from verified subject matter experts