

Question
Please write in NS3 Simulator c++ code! WiFi Performance Analysis Project Outline: In this project, you will work on evaluating the performance of an IEEE
Please write in NS3 Simulator c++ code!
WiFi Performance Analysis Project
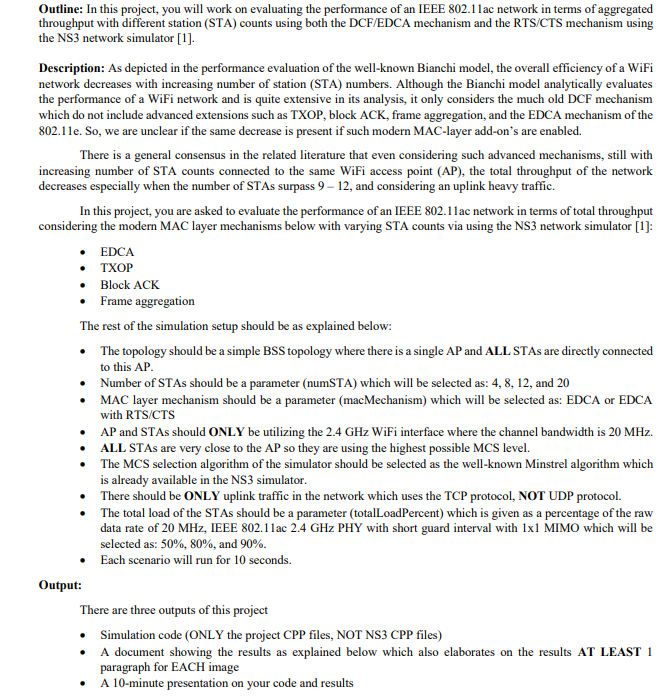
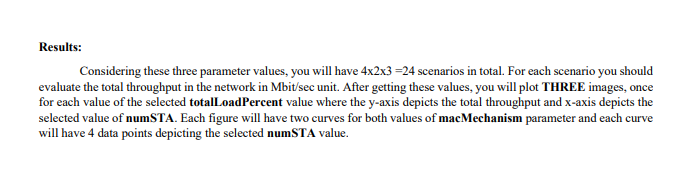
Outline: In this project, you will work on evaluating the performance of an IEEE 802.11ac network in terms of aggregated throughput with different station (STA) counts using both the DCF/EDCA mechanism and the RTS/CTS mechanism using the NS3 network simulator [1]. Description: As depicted in the performance evaluation of the well-known Bianchi model, the overall efficiency of a WiFi network decreases with increasing number of station (STA) numbers. Although the Bianchi model analytically evaluates the performance of a WiFi network and is quite extensive in its analysis, it only considers the much old DCF mechanism which do not include advanced extensions such as TXOP, block ACK, frame aggregation, and the EDCA mechanism of the 802.11e. So, we are unclear if the same decrease is present if such modern MAC-layer add-ons are enabled. There is a general consensus in the related literature that even considering such advanced mechanisms, still with increasing number of STA counts connected to the same WiFi access point (AP), the total throughput of the network decreases especially when the number of STAs surpass 9 12, and considering an uplink heavy traffic. In this project, you are asked to evaluate the performance of an IEEE 802.11ac network in terms of total throughput considering the modern MAC layer mechanisms below with varying STA counts via using the NS3 network simulator [1]: EDCA TXOP Block ACK Frame aggregation The rest of the simulation setup should be as explained below: The topology should be a simple BSS topology where there is a single AP and ALL STAs are directly connected to this AP. Number of STAs should be a parameter (numSTA) which will be selected as: 4, 8, 12, and 20 MAC layer mechanism should be a parameter (macMechanism) which will be selected as: EDCA or EDCA with RTS/CTS AP and STAs should ONLY be utilizing the 2.4 GHz WiFi interface where the channel bandwidth is 20 MHz. ALL STAs are very close to the AP so they are using the highest possible MCS level. The MCS selection algorithm of the simulator should be selected as the well-known Minstrel algorithm which is already available in the NS3 simulator. There should be ONLY uplink traffic in the network which uses the TCP protocol, NOT UDP protocol. The total load of the STAs should be a parameter (totalLoadPercent) which is given as a percentage of the raw data rate of 20 MHz, IEEE 802.11ac 2.4 GHz PHY with short guard interval with 1x1 MIMO which will be selected as: 50%, 80%, and 90%. Each scenario will run for 10 seconds. Output: There are three outputs of this project Simulation code (ONLY the project CPP files, NOT NS3 CPP files) A document showing the results as explained below which also elaborates on the results AT LEAST 1 paragraph for EACH image A 10-minute presentation on your code and results 2 Results: Considering these three parameter values, you will have 4x2x3 =24 scenarios in total. For each scenario you should evaluate the total throughput in the network in Mbit/sec unit. After getting these values, you will plot THREE images, once for each value of the selected totalLoadPercent value where the y-axis depicts the total throughput and x-axis depicts the selected value of numSTA. Each figure will have two curves for both values of macMechanism parameter and each curve will have 4 data points depicting the selected numSTA value
Step by Step Solution
There are 3 Steps involved in it
Step: 1

Get Instant Access to Expert-Tailored Solutions
See step-by-step solutions with expert insights and AI powered tools for academic success
Step: 2

Step: 3
Ace Your Homework with AI
Get the answers you need in no time with our AI-driven, step-by-step assistance
Get Started
Securing SQL Server Protecting Your Database From Attackers
Authors: Denny Cherry
2nd Edition
1597499471, 978-1597499477