

Answered step by step
Verified Expert Solution
Question
1 Approved Answer
Please write the following Matlab function: Write the function plot_histogram that takes as input a histogram (as returned from compute histogram) and plots it similar
Please write the following Matlab function:
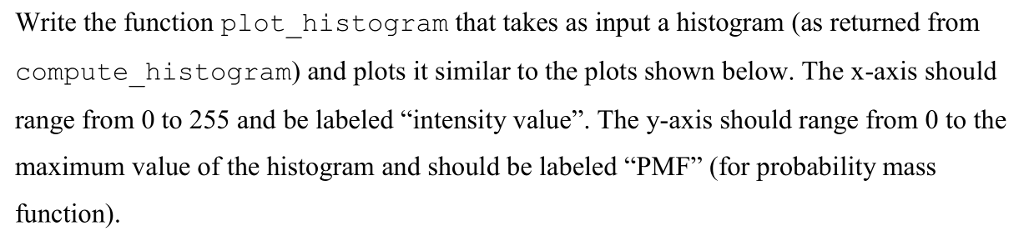
Write the function plot_histogram that takes as input a histogram (as returned from compute histogram) and plots it similar to the plots shown below. The x-axis should range from 0 to 255 and be labeled "intensity value". The y-axis should range from 0 to the maximum value of the histogram and should be labeled "PMF" (for probability mass function). Write the function plot_histogram that takes as input a histogram (as returned from compute histogram) and plots it similar to the plots shown below. The x-axis should range from 0 to 255 and be labeled "intensity value". The y-axis should range from 0 to the maximum value of the histogram and should be labeled "PMF" (for probability mass function)
Step by Step Solution
There are 3 Steps involved in it
Step: 1

Get Instant Access to Expert-Tailored Solutions
See step-by-step solutions with expert insights and AI powered tools for academic success
Step: 2

Step: 3
Ace Your Homework with AI
Get the answers you need in no time with our AI-driven, step-by-step assistance
Get Started
Visual C# And Databases
Authors: Philip Conrod, Lou Tylee
16th Edition
1951077083, 978-1951077082