

Question
Please write the Java implementation for the following assignment. Please write the actual java code. Please follow the outline clearly using the classes and methods
Please write the Java implementation for the following assignment. Please write the actual java code. Please follow the outline clearly using the classes and methods provided above. Also comment fully and upload an image of the output. Thank you
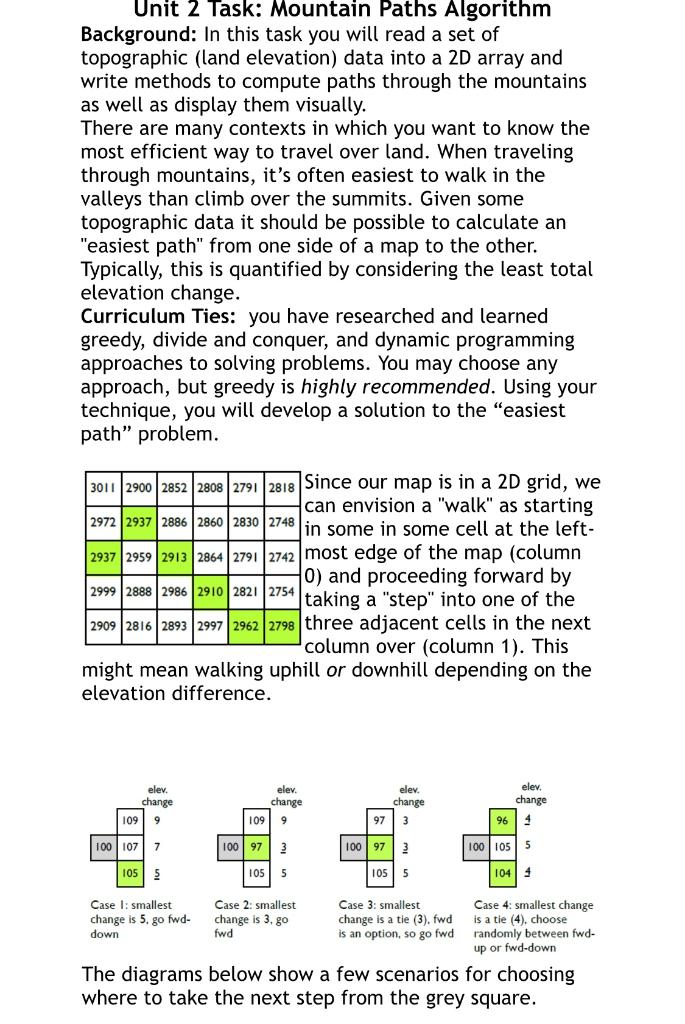
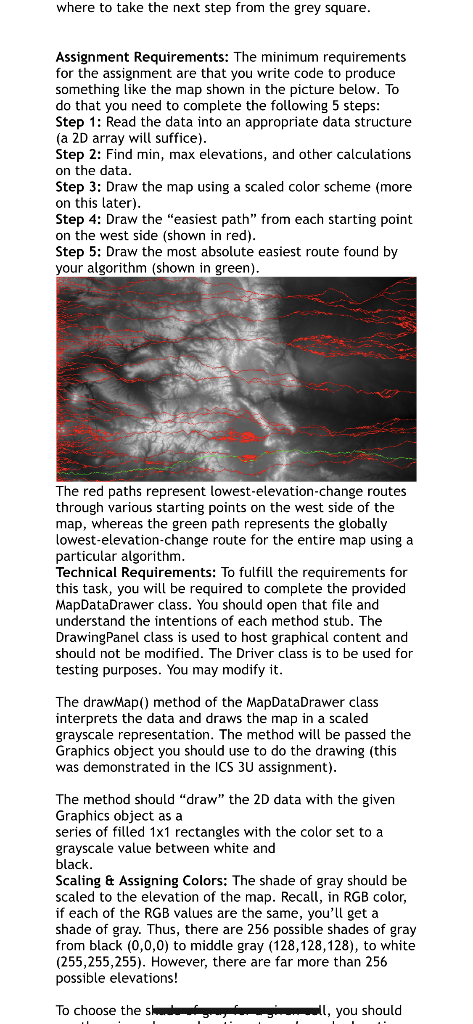
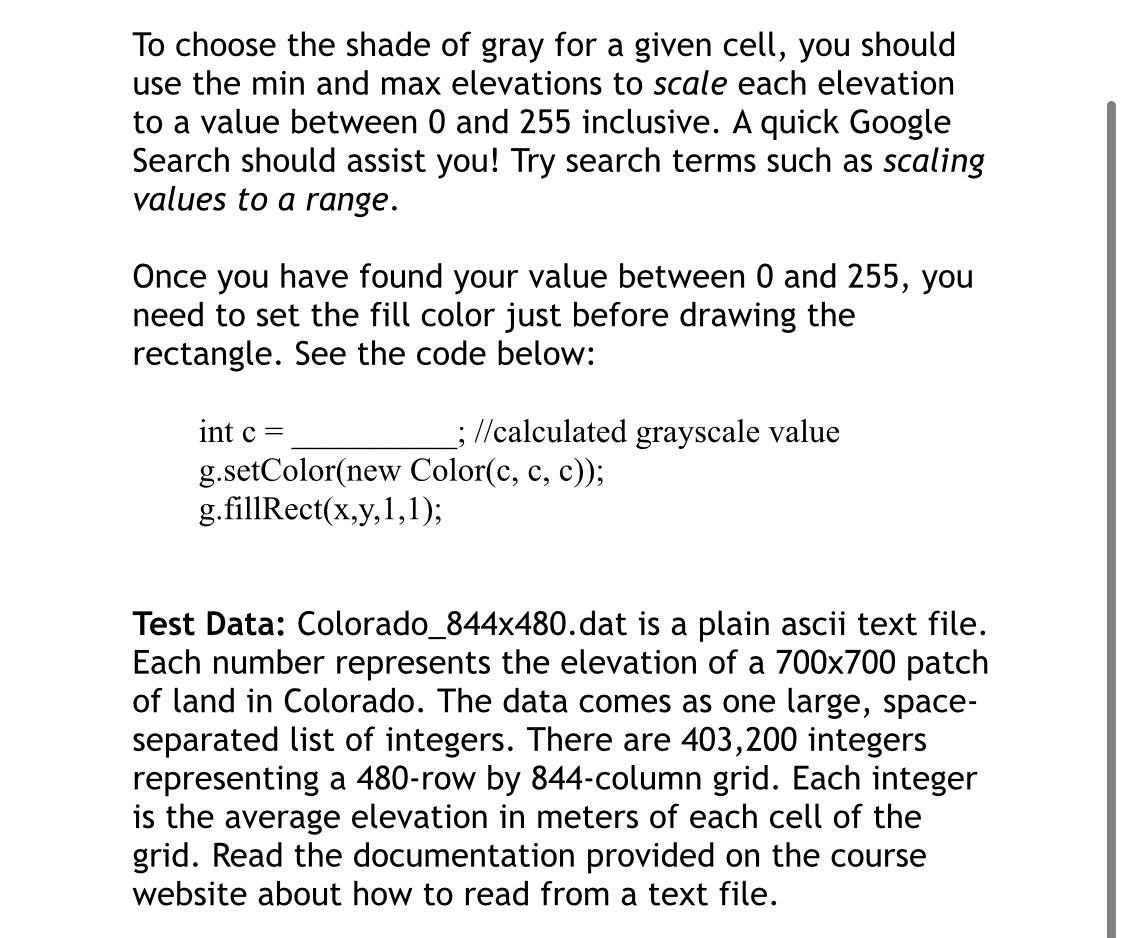
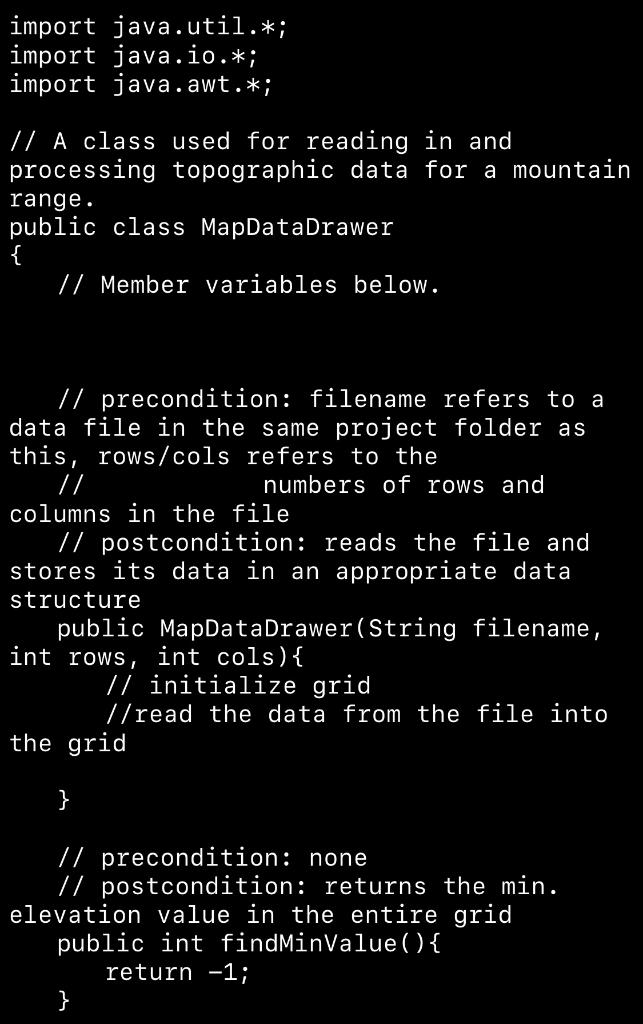
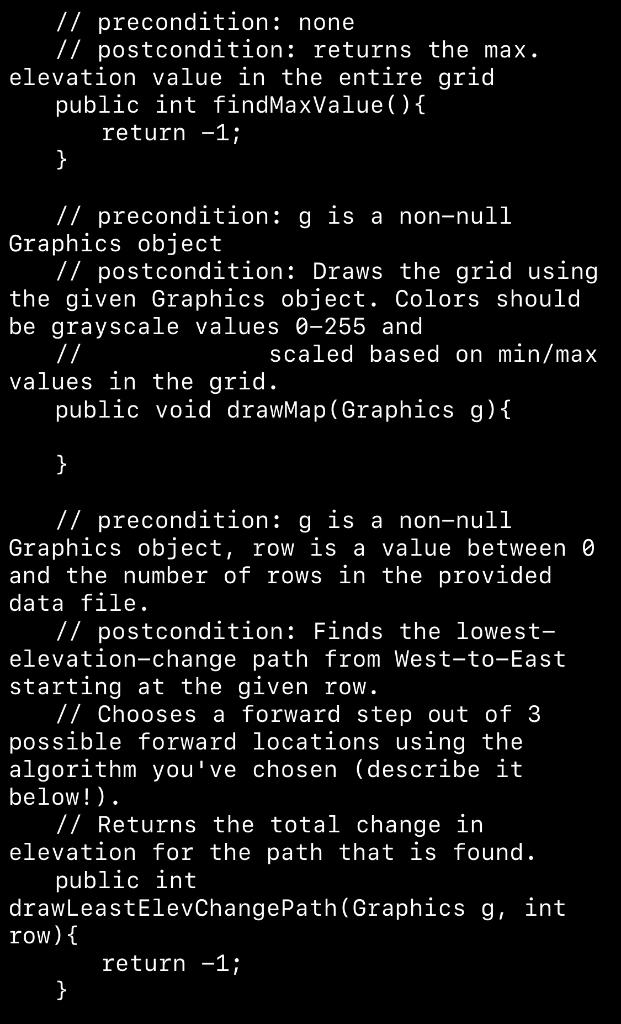
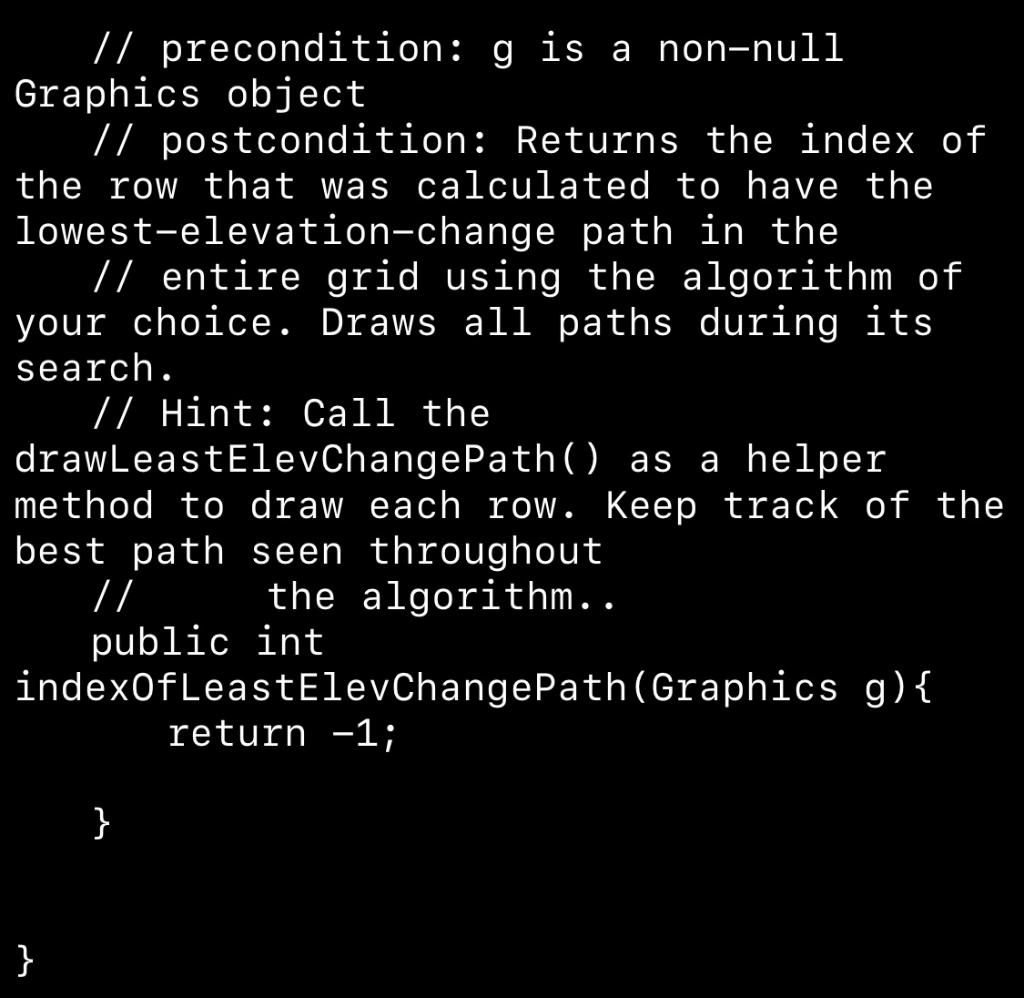
Unit 2 Task: Mountain Paths Algorithm Background: In this task you will read a set of topographic (land elevation) data into a 2D array and write methods to compute paths through the mountains as well as display them visually. There are many contexts in which you want to know the most efficient way to travel over land. When traveling through mountains, it's often easiest to walk in the valleys than climb over the summits. Given some topographic data it should be possible to calculate an "easiest path" from one side of a map to the other. Typically, this is quantified by considering the least total elevation change. Curriculum Ties: you have researched and learned greedy, divide and conquer, and dynamic programming approaches to solving problems. You may choose any approach, but greedy is highly recommended. Using your technique, you will develop a solution to the "easiest path" problem. Since our map is in a 2D grid, we can envision a "walk" as starting in some in some cell at the leftmost edge of the map (column 0) and proceeding forward by taking a "step" into one of the three adjacent cells in the next column over (column 1). This might mean walking uphill or downhill depending on the elevation difference. The diagrams below show a few scenarios for choosing where to take the next step from the grey square. where to take the next step trom the grey square. Assignment Requirements: The minimum requirements for the assignment are that you write code to produce something like the map shown in the picture below. To do that you need to complete the following 5 steps: Step 1: Read the data into an appropriate data structure (a 2D array will suffice). Step 2: Find min, max elevations, and other calculations on the data. Step 3: Draw the map using a scaled color scheme (more on this later). Step 4: Draw the "easiest path" from each starting point on the west side (shown in red). Step 5: Draw the most absolute easiest route found by your algorithm (shown in green). The red paths represent lowest-elevation-change routes through various starting points on the west side of the map, whereas the green path represents the globally lowest-elevation-change route for the entire map using a particular algorithm. Technical Requirements: To fulfill the requirements for this task, you will be required to complete the provided MapDataDrawer class. You should open that file and understand the intentions of each method stub. The DrawingPanel class is used to host graphical content and should not be modified. The Driver class is to be used for testing purposes. You may modify it. The drawMap() method of the MapDataDrawer class interprets the data and draws the map in a scaled grayscale representation. The method will be passed the Graphics object you should use to do the drawing (this was demonstrated in the ICS 3U assignment). The method should "draw" the 2D data with the given Graphics object as a series of filled 11 rectangles with the color set to a grayscale value between white and black. Scaling \& Assigning Colors: The shade of gray should be scaled to the elevation of the map. Recall, in RGB color, if each of the RGB values are the same, you'll get a shade of gray. Thus, there are 256 possible shades of gray from black (0,0,0) to middle gray (128,128,128), to white (255,255,255). However, there are far more than 256 possible elevations! To choose the shade of gray for a given cell, you should use the min and max elevations to scale each elevation to a value between 0 and 255 inclusive. A quick Google Search should assist you! Try search terms such as scaling values to a range. Once you have found your value between 0 and 255 , you need to set the fill color just before drawing the rectangle. See the code below: int c=;// calculated grayscale value g.setColor(new Color(c, c, c )); g.fillRect (x,y,1,1); Test Data: Colorado_844x480.dat is a plain ascii text file. Each number represents the elevation of a 700700 patch of land in Colorado. The data comes as one large, spaceseparated list of integers. There are 403,200 integers representing a 480-row by 844-column grid. Each integer is the average elevation in meters of each cell of the grid. Read the documentation provided on the course website about how to read from a text file. // precondition: g is a non-null Graphics object // postcondition: Returns the index of the row that was calculated to have the lowest-elevation-change path in the // entire grid using the algorithm of your choice. Draws all paths during its search. // Hint: Call the drawLeastElevChangePath() as a helper method to draw each row. Keep track of the best path seen throughout // the algorithm.. public int index0fLeastElevChangePath(Graphics g)\{ return 1; \}Step by Step Solution
There are 3 Steps involved in it
Step: 1

Get Instant Access to Expert-Tailored Solutions
See step-by-step solutions with expert insights and AI powered tools for academic success
Step: 2

Step: 3
Ace Your Homework with AI
Get the answers you need in no time with our AI-driven, step-by-step assistance
Get Started
Privacy In Statistical Databases International Conference Psd 2022 Paris France September 21 23 2022 Proceedings Lncs 13463
Authors: Josep Domingo-Ferrer ,Maryline Laurent
1st Edition
3031139445, 978-3031139444