please write the steps as well to do this in excel. please answer the all case study and do it as soon as possible. please do not post the wrong answer or the previous answer which are already on chegg. thanks.
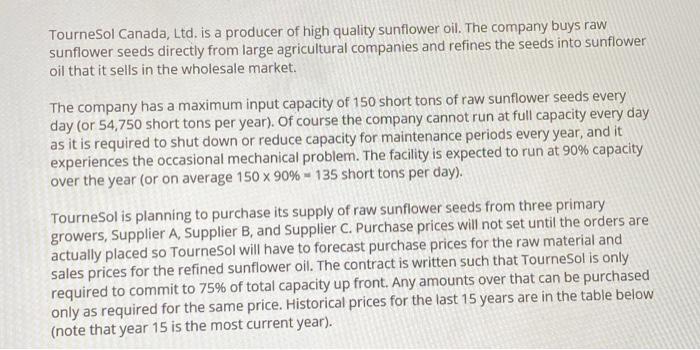
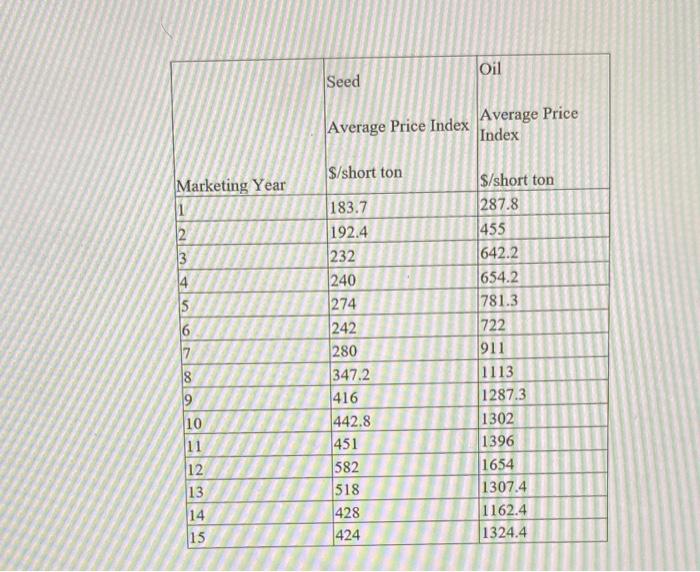
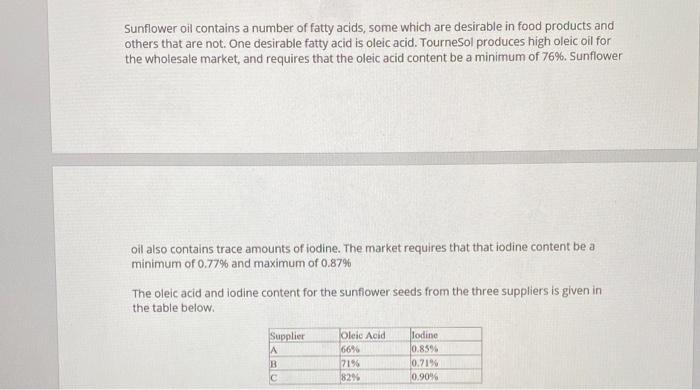
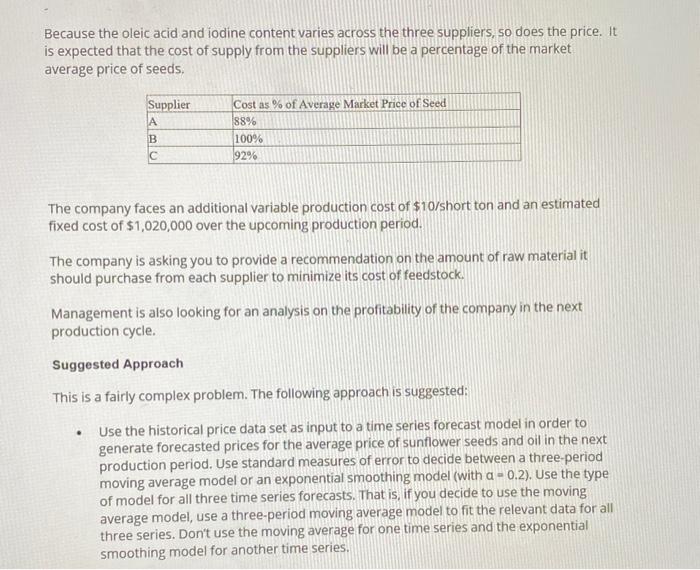
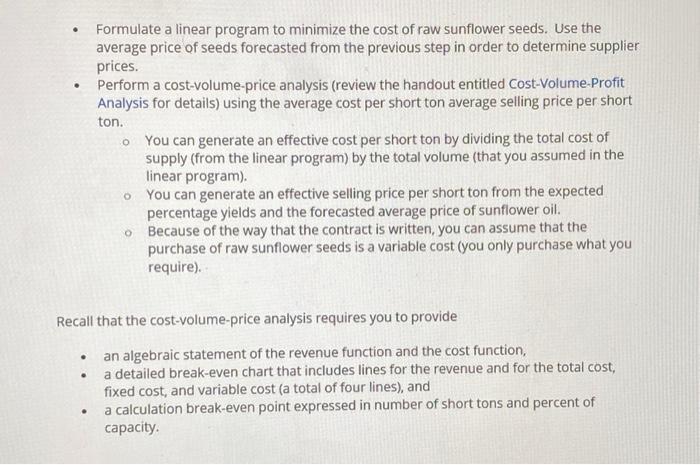
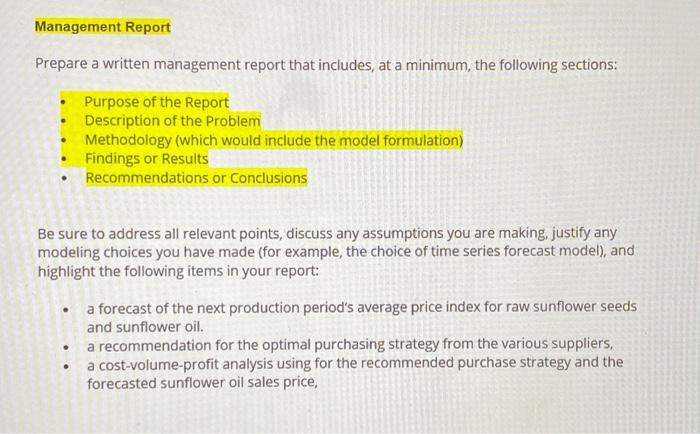
Tournesol Canada, Ltd. is a producer of high quality sunflower oil. The company buys raw sunflower seeds directly from large agricultural companies and refines the seeds into sunflower oil that it sells in the wholesale market: The company has a maximum input capacity of 150 short tons of raw sunflower seeds every day (or 54,750 short tons per year). Of course the company cannot run at full capacity every day as it is required to shut down or reduce capacity for maintenance periods every year, and it experiences the occasional mechanical problem. The facility is expected to run at 90% capacity over the year (or on average 150 X 90% - 135 short tons per day). Tournesol is planning to purchase its supply of raw sunflower seeds from three primary growers, Supplier A, Supplier B, and Supplier C. Purchase prices will not set until the orders are actually placed so Tournesol will have to forecast purchase prices for the raw material and sales prices for the refined sunflower oil. The contract is written such that Tournesol is only required to commit to 75% of total capacity up front. Any amounts over that can be purchased only as required for the same price. Historical prices for the last 15 years are in the table below (note that year 15 is the most current year). Oil Seed Marketing Year 1 2 3 5 6 7 Average Price Average Price Index Index S/short ton $/short ton 183.7 287.8 192.4 455 232 642.2 240 654.2 274 781.3 242 722 280 911 347.2 1113 416 1287.3 442.8 1302 451 1396 582 1654 518 1307.4 428 1162.4 424 1324.4 8 9 10 11 12 13 14 15 Sunflower oil contains a number of fatty acids, some which are desirable in food products and others that are not. One desirable fatty acid is oleic acid. Tournesol produces high oleic oil for the wholesale market, and requires that the oleic acid content be a minimum of 76%. Sunflower oil also contains trace amounts of iodine. The market requires that that iodine content be a minimum of 0.77% and maximum of 0.87% The oleic acid and lodine content for the sunflower seeds from the three suppliers is given in the table below Supplier Oleic Acid 66% 2196 82% lodine 0.85% 0.21% 0.90 B Because the oleic acid and iodine content varies across the three suppliers, so does the price. It is expected that the cost of supply from the suppliers will be a percentage of the market average price of seeds, Supplier B Cost as % of Average Market Price of Seed 88% 100% 92% The company faces an additional variable production cost of $10/short ton and an estimated fixed cost of $1,020,000 over the upcoming production period. The company is asking you to provide a recommendation on the amount of raw material it should purchase from each supplier to minimize its cost of feedstock. Management is also looking for an analysis on the profitability of the company in the next production cycle. Suggested Approach This is a fairly complex problem. The following approach is suggested: Use the historical price data set as input to a time series forecast model in order to generate forecasted prices for the average price of sunflower seeds and oil in the next production period. Use standard measures of error to decide between a three-period moving average model or an exponential smoothing model (with a -0.2). Use the type of model for all three time series forecasts. That is, if you decide to use the moving average model, use a three-period moving average model to fit the relevant data for all three series. Don't use the moving average for one time series and the exponential smoothing model for another time series. Formulate a linear program to minimize the cost of raw sunflower seeds. Use the average price of seeds forecasted from the previous step in order to determine supplier prices. Perform a cost-volume-price analysis (review the handout entitled Cost-Volume-Profit Analysis for details) using the average cost per short ton average selling price per short ton. You can generate an effective cost per short ton by dividing the total cost of supply (from the linear program) by the total volume (that you assumed in the linear program). You can generate an effective selling price per short ton from the expected percentage yields and the forecasted average price of sunflower oil. Because of the way that the contract is written, you can assume that the purchase of raw sunflower seeds is a variable cost (you only purchase what you require). Recall that the cost-volume-price analysis requires you to provide an algebraic statement of the revenue function and the cost function, a detailed break-even chart that includes lines for the revenue and for the total cost, fixed cost, and variable cost (a total of four lines), and a calculation break-even point expressed in number of short tons and percent of capacity Management Report Prepare a written management report that includes, at a minimum, the following sections: Purpose of the Report Description of the Problem Methodology (which would include the model formulation) Findings or Results Recommendations or Conclusions Be sure to address all relevant points, discuss any assumptions you are making, justify any modeling choices you have made (for example, the choice of time series forecast model), and highlight the following items in your report: a forecast of the next production period's average price index for raw sunflower seeds and sunflower oil. a recommendation for the optimal purchasing strategy from the various suppliers, a cost-volume-profit analysis using for the recommended purchase strategy and the forecasted sunflower oil sales price, a discussion of the risks and uncertainties that are faced by the company, and an analysis and opinion on the profitability of the company in the next production period (accounting for the expected profit or loss and the inherent risks/uncertainties. Remember that you are writing the report from the point of view of a consultant with senior management of Tournesol Canada, Ltd. as the intended audience. Tournesol Canada, Ltd. is a producer of high quality sunflower oil. The company buys raw sunflower seeds directly from large agricultural companies and refines the seeds into sunflower oil that it sells in the wholesale market: The company has a maximum input capacity of 150 short tons of raw sunflower seeds every day (or 54,750 short tons per year). Of course the company cannot run at full capacity every day as it is required to shut down or reduce capacity for maintenance periods every year, and it experiences the occasional mechanical problem. The facility is expected to run at 90% capacity over the year (or on average 150 X 90% - 135 short tons per day). Tournesol is planning to purchase its supply of raw sunflower seeds from three primary growers, Supplier A, Supplier B, and Supplier C. Purchase prices will not set until the orders are actually placed so Tournesol will have to forecast purchase prices for the raw material and sales prices for the refined sunflower oil. The contract is written such that Tournesol is only required to commit to 75% of total capacity up front. Any amounts over that can be purchased only as required for the same price. Historical prices for the last 15 years are in the table below (note that year 15 is the most current year). Oil Seed Marketing Year 1 2 3 5 6 7 Average Price Average Price Index Index S/short ton $/short ton 183.7 287.8 192.4 455 232 642.2 240 654.2 274 781.3 242 722 280 911 347.2 1113 416 1287.3 442.8 1302 451 1396 582 1654 518 1307.4 428 1162.4 424 1324.4 8 9 10 11 12 13 14 15 Sunflower oil contains a number of fatty acids, some which are desirable in food products and others that are not. One desirable fatty acid is oleic acid. Tournesol produces high oleic oil for the wholesale market, and requires that the oleic acid content be a minimum of 76%. Sunflower oil also contains trace amounts of iodine. The market requires that that iodine content be a minimum of 0.77% and maximum of 0.87% The oleic acid and lodine content for the sunflower seeds from the three suppliers is given in the table below Supplier Oleic Acid 66% 2196 82% lodine 0.85% 0.21% 0.90 B Because the oleic acid and iodine content varies across the three suppliers, so does the price. It is expected that the cost of supply from the suppliers will be a percentage of the market average price of seeds, Supplier B Cost as % of Average Market Price of Seed 88% 100% 92% The company faces an additional variable production cost of $10/short ton and an estimated fixed cost of $1,020,000 over the upcoming production period. The company is asking you to provide a recommendation on the amount of raw material it should purchase from each supplier to minimize its cost of feedstock. Management is also looking for an analysis on the profitability of the company in the next production cycle. Suggested Approach This is a fairly complex problem. The following approach is suggested: Use the historical price data set as input to a time series forecast model in order to generate forecasted prices for the average price of sunflower seeds and oil in the next production period. Use standard measures of error to decide between a three-period moving average model or an exponential smoothing model (with a -0.2). Use the type of model for all three time series forecasts. That is, if you decide to use the moving average model, use a three-period moving average model to fit the relevant data for all three series. Don't use the moving average for one time series and the exponential smoothing model for another time series. Formulate a linear program to minimize the cost of raw sunflower seeds. Use the average price of seeds forecasted from the previous step in order to determine supplier prices. Perform a cost-volume-price analysis (review the handout entitled Cost-Volume-Profit Analysis for details) using the average cost per short ton average selling price per short ton. You can generate an effective cost per short ton by dividing the total cost of supply (from the linear program) by the total volume (that you assumed in the linear program). You can generate an effective selling price per short ton from the expected percentage yields and the forecasted average price of sunflower oil. Because of the way that the contract is written, you can assume that the purchase of raw sunflower seeds is a variable cost (you only purchase what you require). Recall that the cost-volume-price analysis requires you to provide an algebraic statement of the revenue function and the cost function, a detailed break-even chart that includes lines for the revenue and for the total cost, fixed cost, and variable cost (a total of four lines), and a calculation break-even point expressed in number of short tons and percent of capacity Management Report Prepare a written management report that includes, at a minimum, the following sections: Purpose of the Report Description of the Problem Methodology (which would include the model formulation) Findings or Results Recommendations or Conclusions Be sure to address all relevant points, discuss any assumptions you are making, justify any modeling choices you have made (for example, the choice of time series forecast model), and highlight the following items in your report: a forecast of the next production period's average price index for raw sunflower seeds and sunflower oil. a recommendation for the optimal purchasing strategy from the various suppliers, a cost-volume-profit analysis using for the recommended purchase strategy and the forecasted sunflower oil sales price, a discussion of the risks and uncertainties that are faced by the company, and an analysis and opinion on the profitability of the company in the next production period (accounting for the expected profit or loss and the inherent risks/uncertainties. Remember that you are writing the report from the point of view of a consultant with senior management of Tournesol Canada, Ltd. as the intended audience