Answered step by step
Verified Expert Solution
Question
1 Approved Answer
PLEASEEE WITH THE FORMULAS TO ANSWER THE QUESTION THANKS!(: INTEGRATIVE CASE 3.1 STARBUCKS Exhibit 3.36 presents a statement of cash flows for Starbucks for 2006,


PLEASEEE WITH THE FORMULAS TO ANSWER THE QUESTION THANKS!(:
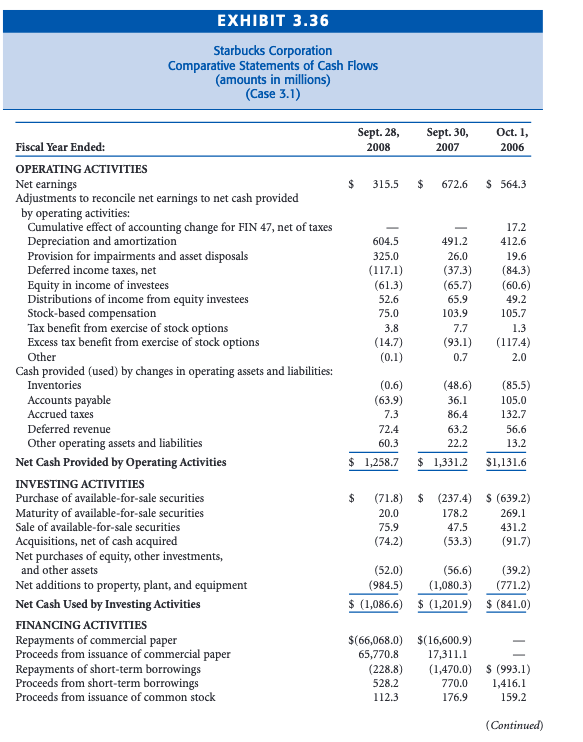
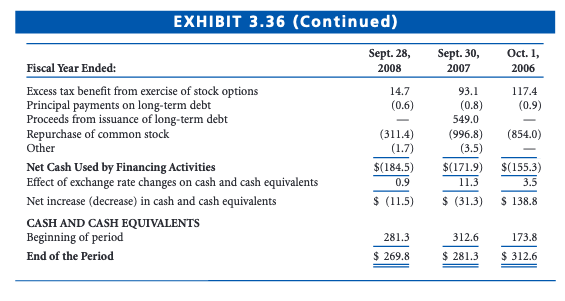
INTEGRATIVE CASE 3.1 STARBUCKS Exhibit 3.36 presents a statement of cash flows for Starbucks for 2006, 2007, and 2008. This statement is an expanded version of the statement of cash flows for Starbucks shown in Exhibit 1.28. g. Discuss the relationships among net income, non-working capital adjustments, working capital adjustments, operating cash flows, and EBITDA for the three years. Are the patterns similar or different? What are the primary determinants of the dif- ferences between the summary measures net income, operating cash flows, and EBITDA? EXHIBIT 3.36 Starbucks Corporation Comparative Statements of Cash Flows (amounts in millions) (Case 3.1) Sept. 28, 2008 Sept. 30, 2007 Oct. 1, 2006 $ 315.5 $ 672.6 $ 564.3 604.5 325.0 (117.1) (61.3) 52.6 75.0 3.8 (14.7) (0.1) 491.2 26.0 (37.3) (65.7) 65.9 103.9 7.7 (93.1) 0.7 17.2 412.6 19.6 (84.3) (60.6) 49.2 105.7 1.3 (117.4) 2.0 (0.6) (63.9) 7.3 Fiscal Year Ended: OPERATING ACTIVITIES Net earnings Adjustments to reconcile net earnings to net cash provided by operating activities: Cumulative effect of accounting change for FIN 47, net of taxes Depreciation and amortization Provision for impairments and asset disposals Deferred income taxes, net Equity in income of investees Distributions of income from equity investees Stock-based compensation Tax benefit from exercise of stock options Excess tax benefit from exercise of stock options Other Cash provided (used) by changes in operating assets and liabilities: Inventories Accounts payable Accrued taxes Deferred revenue Other operating assets and liabilities Net Cash Provided by Operating Activities INVESTING ACTIVITIES Purchase of available-for-sale securities Maturity of available-for-sale securities Sale of available-for-sale securities Acquisitions, net of cash acquired Net purchases of equity, other investments, and other assets Net additions to property, plant, and equipment Net Cash Used by Investing Activities FINANCING ACTIVITIES Repayments of commercial paper Proceeds from issuance of commercial paper Repayments of short-term borrowings Proceeds from short-term borrowings Proceeds from issuance of common stock (48.6) 36.1 86.4 63.2 22.2 (85.5) 105.0 132.7 56.6 13.2 72.4 60.3 $ 1,258.7 $ 1,331.2 $1,131.6 $ $ (71.8) 20,0 75.9 (74.2) (237.4) 178.2 47.5 (53.3) $ (639.2) 269.1 431.2 (91.7) (52.0) (56.6) (984.5) (1,080.3) $ (1,086.6) $ (1,201.9) (39.2) (771.2) $ (841.0) $(66,068.0) $(16,600.9) 65,770.8 17,311.1 (228.8) (1,470.0) S (993.1) 528.2 770.0 1,416.1 112.3 176.9 159.2 (Continued) EXHIBIT 3.36 (Continued) Sept. 30, 2007 Oct. 1, 2006 Sept. 28, 2008 14.7 (0.6) 117.4 (0.9) Fiscal Year Ended: Excess tax benefit from exercise of stock options Principal payments on long-term debt Proceeds from issuance of long-term debt Repurchase of common stock Other Net Cash Used by Financing Activities Effect of exchange rate changes on cash and cash equivalents Net increase (decrease) in cash and cash equivalents CASH AND CASH EQUIVALENTS Beginning of period End of the Period (854.0) 93.1 (0.8) 549.0 (996.8) (3.5) $(171.9) 11.3 (311.4) (1.7) $(184.5) 0.9 $ (11.5) $(155.3) 3.5 $ (31.3) $ 138.8 281.3 173.8 312.6 $ 281.3 $ 269.8 $ 312.6 INTEGRATIVE CASE 3.1 STARBUCKS Exhibit 3.36 presents a statement of cash flows for Starbucks for 2006, 2007, and 2008. This statement is an expanded version of the statement of cash flows for Starbucks shown in Exhibit 1.28. g. Discuss the relationships among net income, non-working capital adjustments, working capital adjustments, operating cash flows, and EBITDA for the three years. Are the patterns similar or different? What are the primary determinants of the dif- ferences between the summary measures net income, operating cash flows, and EBITDA? EXHIBIT 3.36 Starbucks Corporation Comparative Statements of Cash Flows (amounts in millions) (Case 3.1) Sept. 28, 2008 Sept. 30, 2007 Oct. 1, 2006 $ 315.5 $ 672.6 $ 564.3 604.5 325.0 (117.1) (61.3) 52.6 75.0 3.8 (14.7) (0.1) 491.2 26.0 (37.3) (65.7) 65.9 103.9 7.7 (93.1) 0.7 17.2 412.6 19.6 (84.3) (60.6) 49.2 105.7 1.3 (117.4) 2.0 (0.6) (63.9) 7.3 Fiscal Year Ended: OPERATING ACTIVITIES Net earnings Adjustments to reconcile net earnings to net cash provided by operating activities: Cumulative effect of accounting change for FIN 47, net of taxes Depreciation and amortization Provision for impairments and asset disposals Deferred income taxes, net Equity in income of investees Distributions of income from equity investees Stock-based compensation Tax benefit from exercise of stock options Excess tax benefit from exercise of stock options Other Cash provided (used) by changes in operating assets and liabilities: Inventories Accounts payable Accrued taxes Deferred revenue Other operating assets and liabilities Net Cash Provided by Operating Activities INVESTING ACTIVITIES Purchase of available-for-sale securities Maturity of available-for-sale securities Sale of available-for-sale securities Acquisitions, net of cash acquired Net purchases of equity, other investments, and other assets Net additions to property, plant, and equipment Net Cash Used by Investing Activities FINANCING ACTIVITIES Repayments of commercial paper Proceeds from issuance of commercial paper Repayments of short-term borrowings Proceeds from short-term borrowings Proceeds from issuance of common stock (48.6) 36.1 86.4 63.2 22.2 (85.5) 105.0 132.7 56.6 13.2 72.4 60.3 $ 1,258.7 $ 1,331.2 $1,131.6 $ $ (71.8) 20,0 75.9 (74.2) (237.4) 178.2 47.5 (53.3) $ (639.2) 269.1 431.2 (91.7) (52.0) (56.6) (984.5) (1,080.3) $ (1,086.6) $ (1,201.9) (39.2) (771.2) $ (841.0) $(66,068.0) $(16,600.9) 65,770.8 17,311.1 (228.8) (1,470.0) S (993.1) 528.2 770.0 1,416.1 112.3 176.9 159.2 (Continued) EXHIBIT 3.36 (Continued) Sept. 30, 2007 Oct. 1, 2006 Sept. 28, 2008 14.7 (0.6) 117.4 (0.9) Fiscal Year Ended: Excess tax benefit from exercise of stock options Principal payments on long-term debt Proceeds from issuance of long-term debt Repurchase of common stock Other Net Cash Used by Financing Activities Effect of exchange rate changes on cash and cash equivalents Net increase (decrease) in cash and cash equivalents CASH AND CASH EQUIVALENTS Beginning of period End of the Period (854.0) 93.1 (0.8) 549.0 (996.8) (3.5) $(171.9) 11.3 (311.4) (1.7) $(184.5) 0.9 $ (11.5) $(155.3) 3.5 $ (31.3) $ 138.8 281.3 173.8 312.6 $ 281.3 $ 269.8 $ 312.6Step by Step Solution
There are 3 Steps involved in it
Step: 1

Get Instant Access to Expert-Tailored Solutions
See step-by-step solutions with expert insights and AI powered tools for academic success
Step: 2

Step: 3

Ace Your Homework with AI
Get the answers you need in no time with our AI-driven, step-by-step assistance
Get Started


