

Answered step by step
Verified Expert Solution
Question
1 Approved Answer
Pleaseeee calculate wacc Decision Inputs for Quarter Number 1 Company Operating Decisions Units to be produced Div. per common share Demand/price forecast Investment Decisions 100,000
Pleaseeee calculate wacc 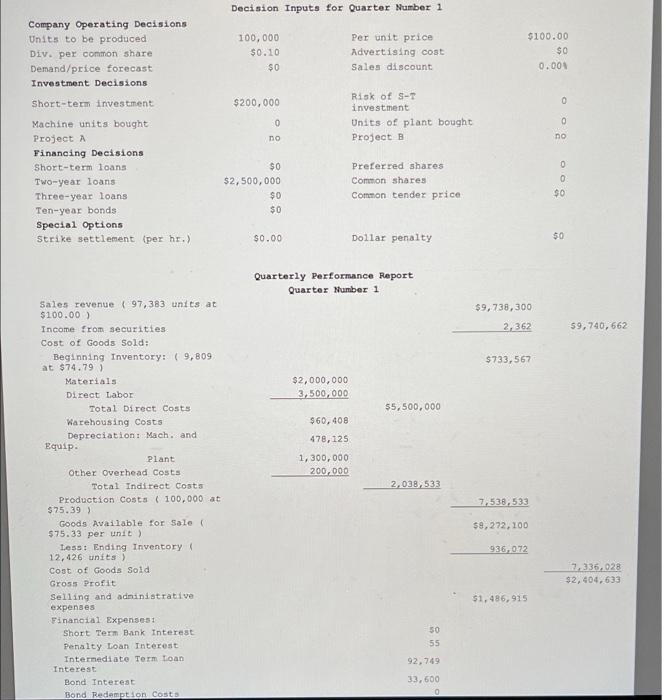
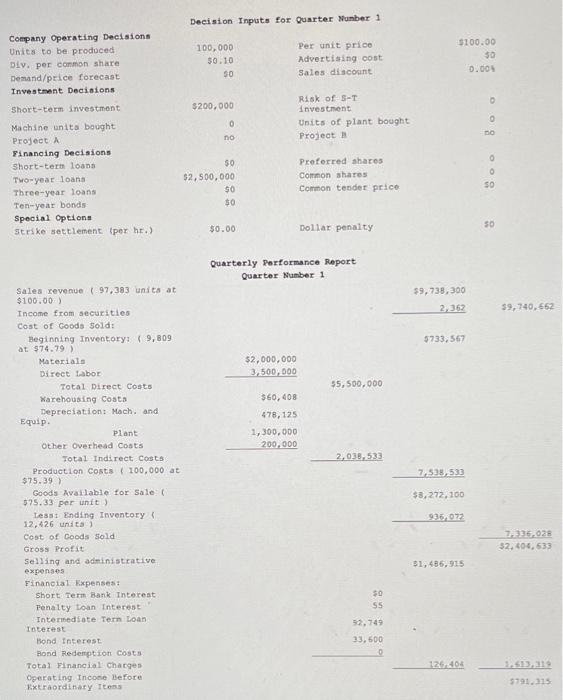
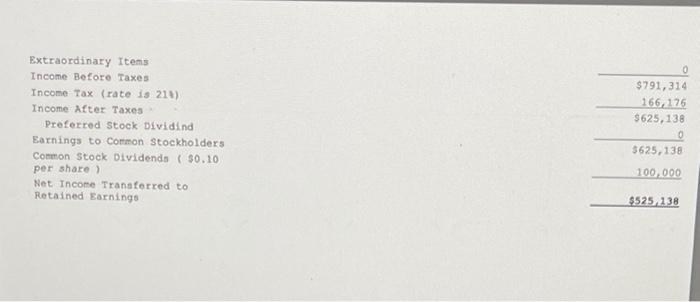
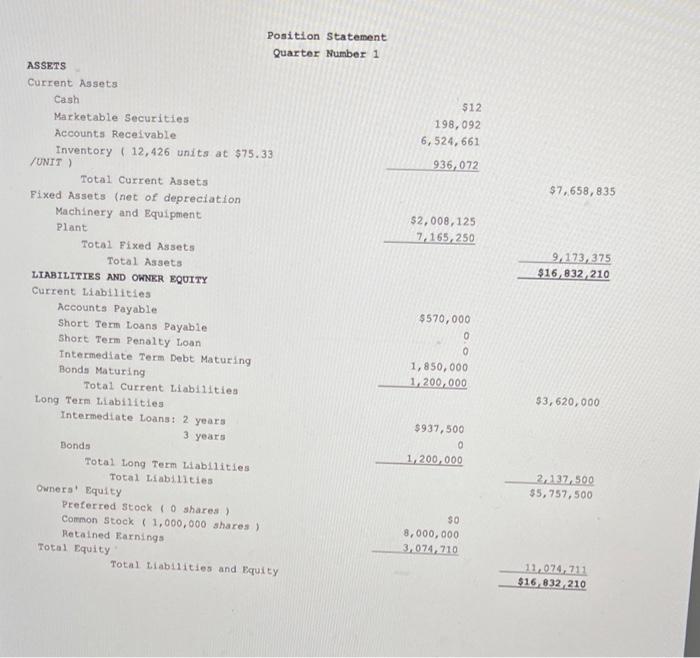
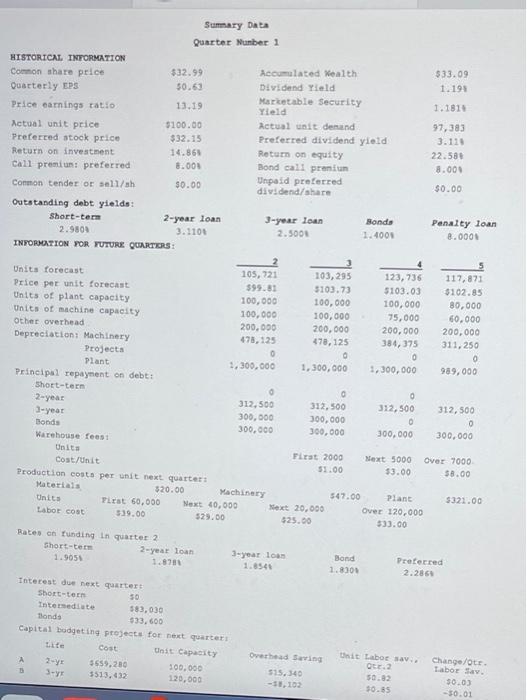
Decision Inputs for Quarter Number 1 Company Operating Decisions Units to be produced Div. per common share Demand/price forecast Investment Decisions 100,000 $0.10 $0 Per unit price Advertising cost Sales discount $100.00 $0 0.001 $200,000 0 Risk of S-T investment Units of plant bought Projects 0 0 no no Short-term investment Machine units bought Project A Financing Decisions Short-term loans TWO-year loans Three-year loans Ten-year bonds Special Options Strike settlement (per hr.) $0 $2,500,000 $0 $0 Preferred Shares Common shares Common tender price 0 0 $0 $0.00 Dollar penalty 50 Quarterly Performance Report Quarter Number 1 $9,738,300 2,362 59,740, 662 $733,567 $2,000,000 3,500,000 55,500,000 $60,408 478,125 1,300,000 200,000 2,038,533 Sales revenue (97,383 units at $100.00) Income from securities Cost of Goods Sold: Beginning Inventory: (9,809 at $74.79) Materials Direct Labor Total Direct Costs Warehousing Costs Depreciation Mach, and Equip. Plant Other Overhead Costs Total Indirect costs Production Costs ( 100,000 at $75.39) Goods Available for Sale $75.33 per unit) Less: Ending Inventory 12,426 units) Cost of Goods Sold Gross Profit Selling and administrative expenses Financial Expenses Short Term Bank Interest Penalty Loan Interest Intermediate Term Loan Interest Bond Interest Bond Redemption Costs 7.538.533 $8,272,100 936.0.72 7,336,028 $2,404.633 $1.486,915 50 55 92,749 33.600 0 Decision Inputs for Quarter Number 1 100,000 30.10 SO Per unit price Advertising cost Sales discount $100.00 30 0.000 $200,000 Company Operating Decisions Units to be produced Div. per common share Demand/price forecast Investment Decisions Short-term investment Machine units bought Project Financing Decisions Short-term loans Two year loans Three-year loans Ten-year bonds Special Options Strike settlement per hr.) Risk of S-T investment Units of plant bought Project 0 no 30 $2,500,000 SO $0 Preferred shares Common shares Common tender price BOO 50 $0.00 Dollar penalty Quarterly Performance Report Quarter Number 1 $9,738,300 2,352 59,740,662 5733,567 $2,000,000 3.500.000 55,500,000 2160, 408 478,125 1,300,000 200.000 2,038-533 7535533 Sales revenue (97,383 units at $100.00) Income from securities Cost of Goods Sold: Beginning Inventory: (9,809 at $74.79) Materials Direct Labor Total Direct Costs Warehousing Costa Depreciation Mach. and Equip. Plant Other Overhead Costs Total Indirect Costa Production Costs (100.000 at $75.39) Goods Available for Sale 525.33 per unit) Less Ending Inventory 12,426 units Cost of Goods Sold Gross Profit Selling and administrative expenses Financial Expenses Short Term Bank Interest Penalty Loan Interest Intermediate Tern Loan Interest Bond Interest Bond Redemption costs Total Financial charges Operating Income Before Extraordinary Tons $3,272,100 935,072 135,028 32, 404,533 31,486,915 30 SS 33,500 126404 5791.315 0 $791,314 166, 125 3625, 138 Extraordinary Items Income Before Taxes Income Tax (rate is 211) Income After Taxes Preferred Stock Dividind Earnings to Common Stockholders Common Stock Dividends ( $0.10 per share Net Income Transferred to Retained Earnings 3625,138 100.000 $525138 $12 198,092 6,524, 661 936,072 $7,658,835 $2,008,125 7,165,250 9,173,375 $16,832,210 Position Statement Quarter Number 1 ASSETS Current Assets Cash Marketable Securities Accounts Receivable Inventory (12,426 units at $75.33 UNIT) Total Current Assets Fixed Assets (net of depreciation Machinery and Equipment Plant Total Fixed Assets Total Assets LIABILITIES AND OHNER EQUITY Current Liabilities Accounts Payable Short Term Loans Payable Short Term Penalty Loan Intermediate Term Debt Maturing Bonds Maturing Total Current Liabilities Long Term Liabilities Intermediate Loans: 2 years 3 years Bonds Total Long Term Liabilities Total Liabilities Owners' Equity Preferred stock ( 0 shares) Comon stock ( 1,000,000 shares) Retained Earnings Total Equity Total Liabilities and Equity $570,000 0 0 1,850,000 1,200,000 $3,620,000 $937,500 a 1,200,000 2,137,500 $5,757,500 $0 8,000,000 3,074,710 11,074,711 $16,832,210 $33.09 1.198 1.1816 Summary DALA Quarter Number 1 HISTORICAL INFORMATION Common share price $32.99 Accumulated Kealth Quarterly EPS $0.63 Dividend Yield Price earnings ratio 13.19 Marketable Security Yield Actual unit price $100.00 Actual unit demand Preferred stock price $32.15 Preferred dividend yield Return on investment 14.86 Retur on equity Call premium preferred 8.000 Bond cali premium Common tender or sell/sh $0.00 Unpaid preferred dividend/share Outstanding debt yields: Short-tem 2-year loan 3-year loan Bonds 2.9809 3.1100 2.500 1.4001 INYORMATION FOR YUTURE QUARTIERS 97,383 3.111 22.581 8.000 $0.00 Penalty loan 8.000 Units forecast 105,721 103, 295 123,736 117,871 Price per unit forecast $99.87 5103.73 5103.03 $102.85 Units of plant capacity 100,000 100,000 100,000 80,000 Units of machine capacity 100,000 100,000 75,000 60.000 other overhead 200.000 200,000 200,000 200,000 Depreciation Machinery 478,125 478,125 384,375 311.250 Projects o O 0 Plant 1,300,000 1,300,000 1,300,000 989,000 Principal repayment on debt: Short-term o 0 2-year 312,500 312,500 312,500 312,500 3-year 300,000 300.000 O 0 Bonds 300,000 300,000 Warehouse feest 300,000 300.000 Units First 2000 Next 5000 Over 7000 Cost/unit 51.00 $3.00 58.00 Production costs per unit next quarters Materiais 520.00 Machinery 547.00 Plant $321.00 Units First 60.000 Next 40,000 Next 20.000 Labor cost Over 120.000 539.00 529.00 $25.00 533.00 Bates ch funding in quarter 2 Short-term 2-year loan 3-year loan Bond 1.9055 Protected 1.871 1.8301 2.286 Interest due next quartert Short-term so Interseite 583.030 fonds 533.600 Capital budgeting projects for next quarters Cost Unit Capacity A 2-Y 5559,280 100.000 3513.432 120,000 Overhead Surin 515,340 -10,102 it Labor sa Qur.2 50.92 10.35 Change/or Labor 30.03 --50.01 Decision Inputs for Quarter Number 1 Company Operating Decisions Units to be produced Div. per common share Demand/price forecast Investment Decisions 100,000 $0.10 $0 Per unit price Advertising cost Sales discount $100.00 $0 0.001 $200,000 0 Risk of S-T investment Units of plant bought Projects 0 0 no no Short-term investment Machine units bought Project A Financing Decisions Short-term loans TWO-year loans Three-year loans Ten-year bonds Special Options Strike settlement (per hr.) $0 $2,500,000 $0 $0 Preferred Shares Common shares Common tender price 0 0 $0 $0.00 Dollar penalty 50 Quarterly Performance Report Quarter Number 1 $9,738,300 2,362 59,740, 662 $733,567 $2,000,000 3,500,000 55,500,000 $60,408 478,125 1,300,000 200,000 2,038,533 Sales revenue (97,383 units at $100.00) Income from securities Cost of Goods Sold: Beginning Inventory: (9,809 at $74.79) Materials Direct Labor Total Direct Costs Warehousing Costs Depreciation Mach, and Equip. Plant Other Overhead Costs Total Indirect costs Production Costs ( 100,000 at $75.39) Goods Available for Sale $75.33 per unit) Less: Ending Inventory 12,426 units) Cost of Goods Sold Gross Profit Selling and administrative expenses Financial Expenses Short Term Bank Interest Penalty Loan Interest Intermediate Term Loan Interest Bond Interest Bond Redemption Costs 7.538.533 $8,272,100 936.0.72 7,336,028 $2,404.633 $1.486,915 50 55 92,749 33.600 0 Decision Inputs for Quarter Number 1 100,000 30.10 SO Per unit price Advertising cost Sales discount $100.00 30 0.000 $200,000 Company Operating Decisions Units to be produced Div. per common share Demand/price forecast Investment Decisions Short-term investment Machine units bought Project Financing Decisions Short-term loans Two year loans Three-year loans Ten-year bonds Special Options Strike settlement per hr.) Risk of S-T investment Units of plant bought Project 0 no 30 $2,500,000 SO $0 Preferred shares Common shares Common tender price BOO 50 $0.00 Dollar penalty Quarterly Performance Report Quarter Number 1 $9,738,300 2,352 59,740,662 5733,567 $2,000,000 3.500.000 55,500,000 2160, 408 478,125 1,300,000 200.000 2,038-533 7535533 Sales revenue (97,383 units at $100.00) Income from securities Cost of Goods Sold: Beginning Inventory: (9,809 at $74.79) Materials Direct Labor Total Direct Costs Warehousing Costa Depreciation Mach. and Equip. Plant Other Overhead Costs Total Indirect Costa Production Costs (100.000 at $75.39) Goods Available for Sale 525.33 per unit) Less Ending Inventory 12,426 units Cost of Goods Sold Gross Profit Selling and administrative expenses Financial Expenses Short Term Bank Interest Penalty Loan Interest Intermediate Tern Loan Interest Bond Interest Bond Redemption costs Total Financial charges Operating Income Before Extraordinary Tons $3,272,100 935,072 135,028 32, 404,533 31,486,915 30 SS 33,500 126404 5791.315 0 $791,314 166, 125 3625, 138 Extraordinary Items Income Before Taxes Income Tax (rate is 211) Income After Taxes Preferred Stock Dividind Earnings to Common Stockholders Common Stock Dividends ( $0.10 per share Net Income Transferred to Retained Earnings 3625,138 100.000 $525138 $12 198,092 6,524, 661 936,072 $7,658,835 $2,008,125 7,165,250 9,173,375 $16,832,210 Position Statement Quarter Number 1 ASSETS Current Assets Cash Marketable Securities Accounts Receivable Inventory (12,426 units at $75.33 UNIT) Total Current Assets Fixed Assets (net of depreciation Machinery and Equipment Plant Total Fixed Assets Total Assets LIABILITIES AND OHNER EQUITY Current Liabilities Accounts Payable Short Term Loans Payable Short Term Penalty Loan Intermediate Term Debt Maturing Bonds Maturing Total Current Liabilities Long Term Liabilities Intermediate Loans: 2 years 3 years Bonds Total Long Term Liabilities Total Liabilities Owners' Equity Preferred stock ( 0 shares) Comon stock ( 1,000,000 shares) Retained Earnings Total Equity Total Liabilities and Equity $570,000 0 0 1,850,000 1,200,000 $3,620,000 $937,500 a 1,200,000 2,137,500 $5,757,500 $0 8,000,000 3,074,710 11,074,711 $16,832,210 $33.09 1.198 1.1816 Summary DALA Quarter Number 1 HISTORICAL INFORMATION Common share price $32.99 Accumulated Kealth Quarterly EPS $0.63 Dividend Yield Price earnings ratio 13.19 Marketable Security Yield Actual unit price $100.00 Actual unit demand Preferred stock price $32.15 Preferred dividend yield Return on investment 14.86 Retur on equity Call premium preferred 8.000 Bond cali premium Common tender or sell/sh $0.00 Unpaid preferred dividend/share Outstanding debt yields: Short-tem 2-year loan 3-year loan Bonds 2.9809 3.1100 2.500 1.4001 INYORMATION FOR YUTURE QUARTIERS 97,383 3.111 22.581 8.000 $0.00 Penalty loan 8.000 Units forecast 105,721 103, 295 123,736 117,871 Price per unit forecast $99.87 5103.73 5103.03 $102.85 Units of plant capacity 100,000 100,000 100,000 80,000 Units of machine capacity 100,000 100,000 75,000 60.000 other overhead 200.000 200,000 200,000 200,000 Depreciation Machinery 478,125 478,125 384,375 311.250 Projects o O 0 Plant 1,300,000 1,300,000 1,300,000 989,000 Principal repayment on debt: Short-term o 0 2-year 312,500 312,500 312,500 312,500 3-year 300,000 300.000 O 0 Bonds 300,000 300,000 Warehouse feest 300,000 300.000 Units First 2000 Next 5000 Over 7000 Cost/unit 51.00 $3.00 58.00 Production costs per unit next quarters Materiais 520.00 Machinery 547.00 Plant $321.00 Units First 60.000 Next 40,000 Next 20.000 Labor cost Over 120.000 539.00 529.00 $25.00 533.00 Bates ch funding in quarter 2 Short-term 2-year loan 3-year loan Bond 1.9055 Protected 1.871 1.8301 2.286 Interest due next quartert Short-term so Interseite 583.030 fonds 533.600 Capital budgeting projects for next quarters Cost Unit Capacity A 2-Y 5559,280 100.000 3513.432 120,000 Overhead Surin 515,340 -10,102 it Labor sa Qur.2 50.92 10.35 Change/or Labor 30.03 --50.01 Step by Step Solution
There are 3 Steps involved in it
Step: 1

Get Instant Access to Expert-Tailored Solutions
See step-by-step solutions with expert insights and AI powered tools for academic success
Step: 2

Step: 3
Ace Your Homework with AI
Get the answers you need in no time with our AI-driven, step-by-step assistance
Get Started
Investments Analysis and Management
Authors: Charles P. Jones
12th edition
978-1118475904, 1118475909, 1118363299, 978-1118363294