Answered step by step
Verified Expert Solution
Question
1 Approved Answer
Plot a bacterial growth curve. Submit the two growth curves to CANVAS. 1.1. Graph #1: A bacterial growth curve based on Spec readings (one growth
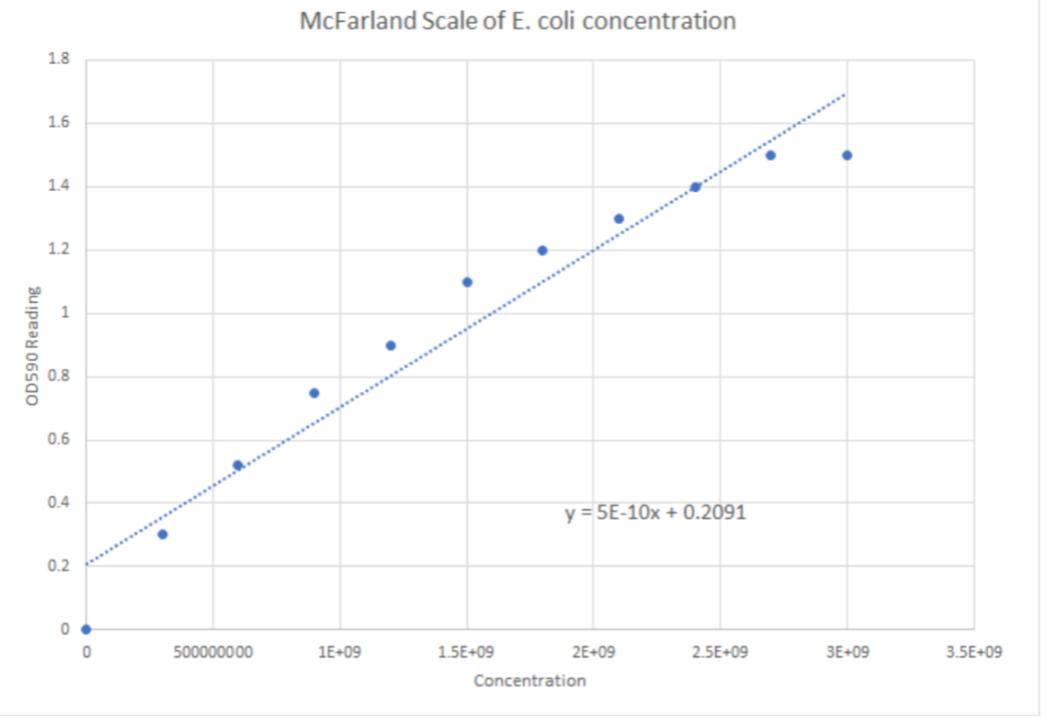
 Plot a bacterial growth curve. Submit the two growth curves to CANVAS. 1.1. Graph #1: A bacterial growth curve based on Spec readings (one growth curve with 5 time points: 1.5h, 2h, 2.5h, 3h, and 3.5h). Instructions for completing graph 1 are as follows: 1.1.1. Show me the calculation steps of determining E. coli concentration for each of the five time points (1.5h, 2h, 2.5h, 3h, and 3.5h) using the equation on the McFarland standard curve. The OD590 of the five time points of E. coli can be found on the lab ppt slides on Oct. 27th. 1.1.2. Log10 transforms the five bacterial cell concentrations using a calculator. For self-checking, the value after transformation should be between 5-11. 1.1.3. In Excel, plot the bacterial growth curve. The Y-axis must be Log10(concentration of the total number of cells) and the X-axis must be “time of incubation”. Please make sure to use linear scales on both the X and Y axes. If you plan to submit a hand-drawn growth curve, please use normal graph paper with linear scales on both axes for this assignment.
 OD590 Reading 1.8 1.6 1.4 1.2 1 0.8 0.6 0.4 0.2 0 0 500000000 McFarland Scale of E. coli concentration 1E+09 1.5E+09 y=5E-10x + 0.2091 2E+09 Concentration 2.5E+09 3E+09 3.5E+09
Step by Step Solution
★★★★★
3.32 Rating (152 Votes )
There are 3 Steps involved in it
Step: 1
To create the bacterial growth curve in Excel Open Excel and create a table with two columns Time of ...
Get Instant Access to Expert-Tailored Solutions
See step-by-step solutions with expert insights and AI powered tools for academic success
Step: 2

Step: 3

Ace Your Homework with AI
Get the answers you need in no time with our AI-driven, step-by-step assistance
Get Started


