

Answered step by step
Verified Expert Solution
Question
1 Approved Answer
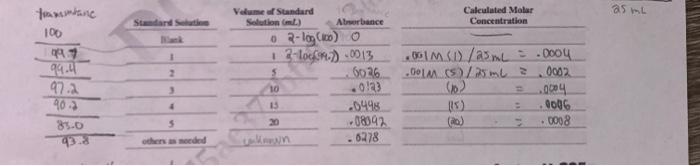
plot a calibration curve, x= absorbance y=transmitance Plot the calibration curve of aboobance versus molar concentration for the standard solutions. Dete Analysis, F, 6 Calculate
plot a calibration curve, x= absorbance y=transmitance 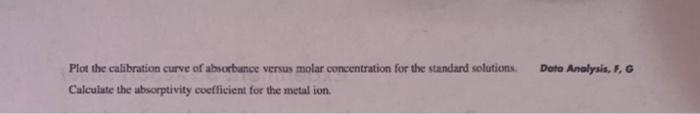
Step by Step Solution
There are 3 Steps involved in it
Step: 1

Get Instant Access to Expert-Tailored Solutions
See step-by-step solutions with expert insights and AI powered tools for academic success
Step: 2

Step: 3
Ace Your Homework with AI
Get the answers you need in no time with our AI-driven, step-by-step assistance
Get Started
Chemistry
Authors: John McMurry, Robert C. Fay
4th Edition
131402080, 978-0131402089