

Question
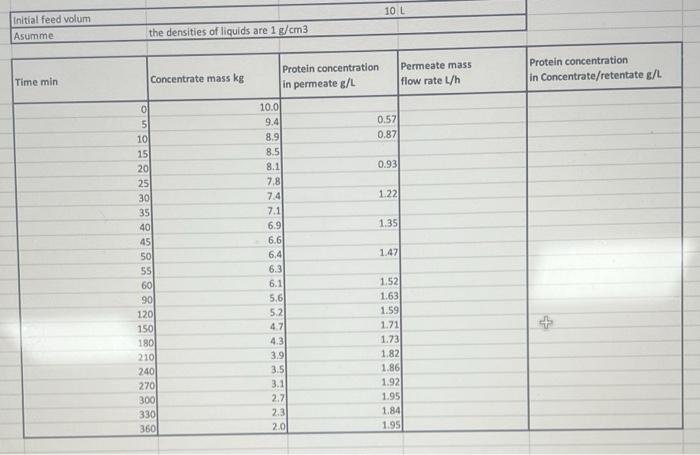
Plot a figure of permeate flowrate (L/h) over ultrafiltration time and describe the results. Plot concentrations of protein in the retentate/concentrate over filtration time in
Plot a figure of permeate flowrate (L/h) over ultrafiltration time and describe the results.
Plot concentrations of protein in the retentate/concentrate over filtration time in a figure and describe it.
Calculate the rejection of protein at the end of ultrafiltration.
A milk mixture was prepared by dissolving of 400g of skimmed milk powder into a 10L milk solution.
The milk solution was then added to the filtration tank. The flow rate was observed over the time it took to has 2L of the solution left in the concentrate. Sample of permeate were collected until 8L total of permeate was obtained.
Water was added to the feed tank containing protein concentrate. The volume of water added to the feed tank was calculated. The addition of water results in the lactose concentration being 1/20th of original concertation.
per 100G: Protein: 36.1g Carbohydrate: 52.9g (all carbohydrates are lactose)
Step by Step Solution
There are 3 Steps involved in it
Step: 1

Get Instant Access to Expert-Tailored Solutions
See step-by-step solutions with expert insights and AI powered tools for academic success
Step: 2

Step: 3
Ace Your Homework with AI
Get the answers you need in no time with our AI-driven, step-by-step assistance
Get Started
Chemical Engineering An Introduction
Authors: Morton Denn
1st Edition
1107011892, 9781107011892