

Answered step by step
Verified Expert Solution
Question
1 Approved Answer
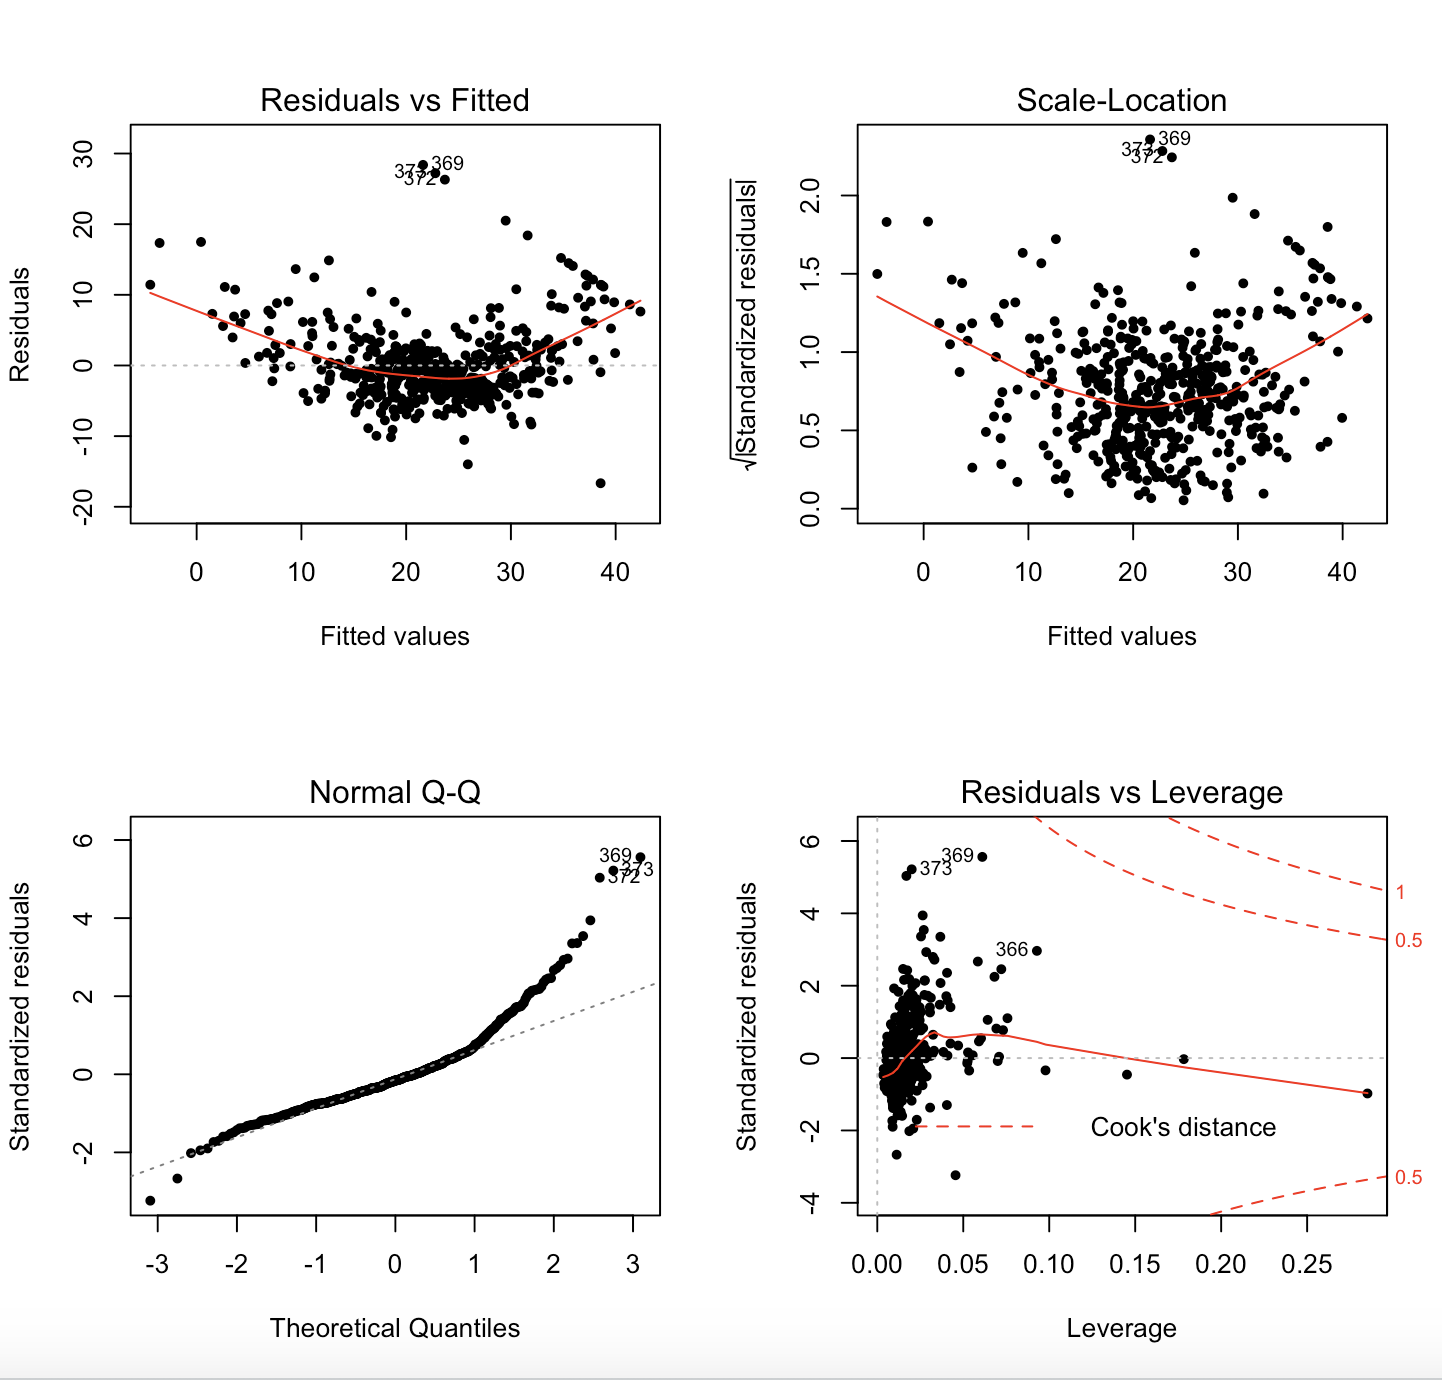
Plot the 4-in-1 residual diagnostic plot. How do you feel about the multiple regression model given this extra information. Residuals vs Fitted Scale-Location 37-3-30 20
Plot the 4-in-1 residual diagnostic plot. How do you feel about the multiple regression model given this extra information.
Step by Step Solution
There are 3 Steps involved in it
Step: 1

Get Instant Access to Expert-Tailored Solutions
See step-by-step solutions with expert insights and AI powered tools for academic success
Step: 2

Step: 3
Ace Your Homework with AI
Get the answers you need in no time with our AI-driven, step-by-step assistance
Get Started
Intermediate Algebra A Text/Workbook
Authors: Charles P McKeague
2nd Edition
1483214176, 9781483214177