Question
Plot the data Load the data for the training examples into your program and add the intercept term into your x matrix. Before beginning Newton's
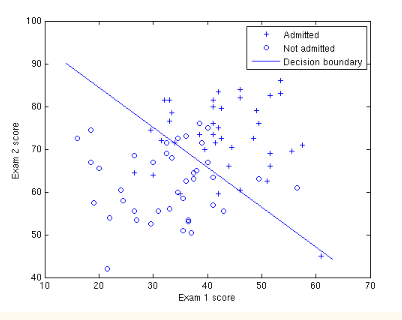
Plot the data Load the data for the training examples into your program and add the intercept term into your x matrix. Before beginning Newton's Method, we will first plot the data using different symbols to represent the two classes. In MATLAB, you can separate the positive class and the negative class using the find command:
% find returns the indices of the % rows meeting the specified condition pos = find(y == 1); neg = find(y == 0); % Assume the features are in the 2nd and 3rd % columns of x plot(x(pos, 2), x(pos,3), '+'); hold on plot(x(neg, 2), x(neg, 3), 'o');
g = inline('1.0 ./ (1.0 + exp(-z))'); % Usage: To find the value of the sigmoid % evaluated at 2, call g(2) this is my code close all clear all clc % find returns the indices of the % rows meeting the specified condition x = load('ex4x.dat'); y = load('ex4y.dat'); m = length(y); % store the number of training examples x = [ones(m, 1), x]; % Add a column of ones to x pos = find(y == 1); neg = find(y == 0); % Assume the features are in the 2nd and 3rd % columns of x plot(x(pos, 2), x(pos,3), '+'); hold on plot(x(neg, 2), x(neg, 3), 'o'); xlabel('Exam 1 score'); ylabel('Exam 2 score'); g = @(z) 1.0 ./ (1.0 + exp(-z)); % Usage: To find the value of the sigmoid % evaluated at 2, call g(2) g(2) theta=zeros(size(x(1,:)))'; MAX_ITR=1500; alpha=0.07; for num_iterations = 1:MAX_ITR gradient= (1/m) .*x'* (x*theta-y); theta = theta - alpha*(gradient) end hold on % Plot new data without clearing old plot plot(x(:,2), x*theta, '-') % remember that x is now a matrix with 2 columns % and the second column contains the time info legend('Training data', 'Linear regression');

Questions Finally,
Upload your code with the your answers to the following questions:
1. What values of did you get?
2. How many iterations were required for convergence?
3. What is the probability that a student with a score of 20 on Exam 1 and a score of 80 on Exam 2 will not be admitted?
100 Adm itted Not admitted O Decision boundary 80 N 70 20 40 Exam 1 score 70 100 Adm itted Not admitted O Decision boundary 80 N 70 20 40 Exam 1 score 70
Step by Step Solution
There are 3 Steps involved in it
Step: 1

Get Instant Access to Expert-Tailored Solutions
See step-by-step solutions with expert insights and AI powered tools for academic success
Step: 2

Step: 3

Ace Your Homework with AI
Get the answers you need in no time with our AI-driven, step-by-step assistance
Get Started


