Answered step by step
Verified Expert Solution
Question
1 Approved Answer
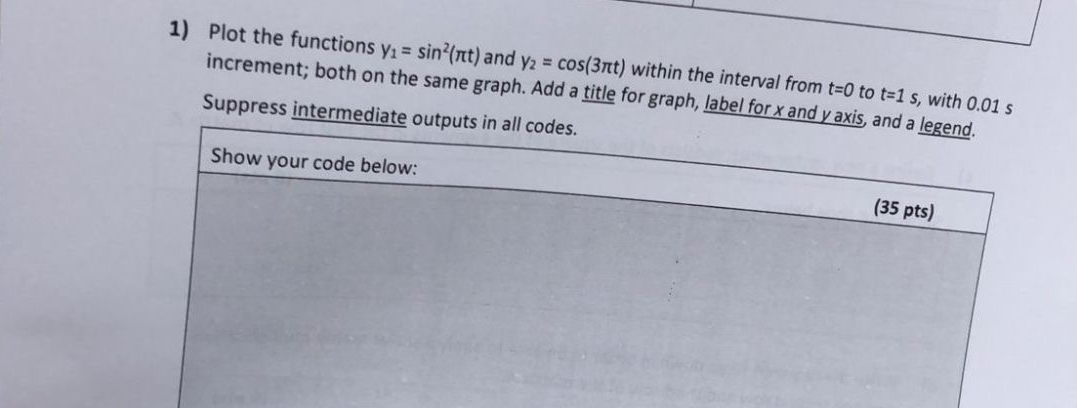
Plot the functions y 1 = s i n 2 ( t ) and y 2 = c o s ( 3 t ) within
Plot the functions and within the interval from to with increment; both on the same graph. Add a title for graph, label for and axis, and a legend. Suppress intermediate outputs in all codes.
Show your code below:
pts

Step by Step Solution
There are 3 Steps involved in it
Step: 1

Get Instant Access to Expert-Tailored Solutions
See step-by-step solutions with expert insights and AI powered tools for academic success
Step: 2

Step: 3

Ace Your Homework with AI
Get the answers you need in no time with our AI-driven, step-by-step assistance
Get Started


