

Answered step by step
Verified Expert Solution
Question
1 Approved Answer
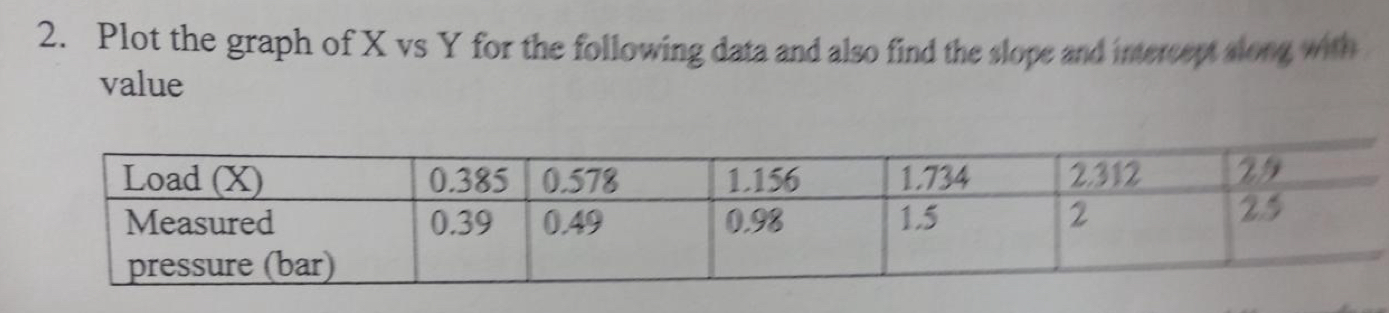
Plot the graph of x vs Y for the following data and also find the slope and interepe slong wibh value table [ [
Plot the graph of vs for the following data and also find the slope and interepe slong wibh value
tableLoad XtableMeasuredpressure bar
Step by Step Solution
There are 3 Steps involved in it
Step: 1

Get Instant Access to Expert-Tailored Solutions
See step-by-step solutions with expert insights and AI powered tools for academic success
Step: 2

Step: 3
Ace Your Homework with AI
Get the answers you need in no time with our AI-driven, step-by-step assistance
Get Started
Thermodynamics Fundamentals For Applications
Authors: J. P. O'Connell, J. M. Haile
1st Edition
0521582067, 978-0521582063