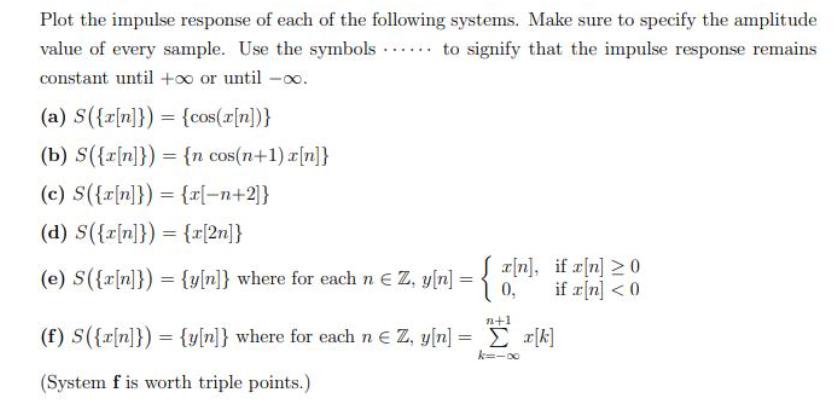
Plot the impulse response of each of the following systems. Make sure to specify the amplitude value of every sample. Use the symbols constant


Plot the impulse response of each of the following systems. Make sure to specify the amplitude value of every sample. Use the symbols constant until + or until -. (a) S({[n]})= {cos(x[n])} (b) S({[n]}) = {n cos(n+1)x[n]} (c) S({a[n]}) = {x[-n+2]} (d) S({[n]})= {[2n]} to signify that the impulse response remains (e) S({x[n]}) = {y[n]} where for each n Z, y[n] = { [n], if [n] 0, n+1 (f) S({x[n]}) = {y[n]} where for each n Z, y[n] = x[k] < 0 (System f is worth triple points.) k=- State whether each system of Problem above is linear or not. If not, explain why.
Step by Step Solution
There are 3 Steps involved in it
Step: 1

See step-by-step solutions with expert insights and AI powered tools for academic success
Step: 2

Step: 3

Ace Your Homework with AI
Get the answers you need in no time with our AI-driven, step-by-step assistance
Get Started


