Answered step by step
Verified Expert Solution
Question
1 Approved Answer
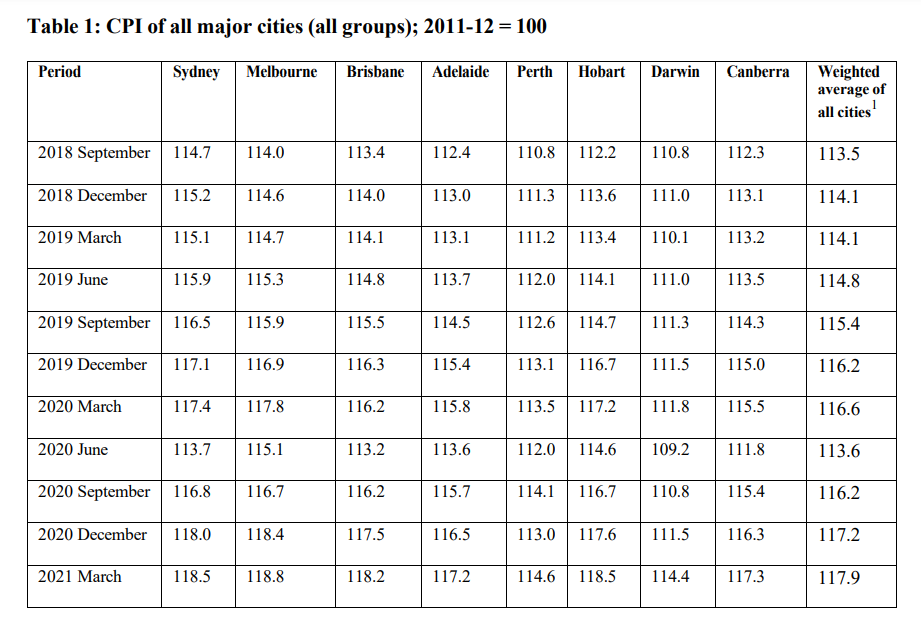
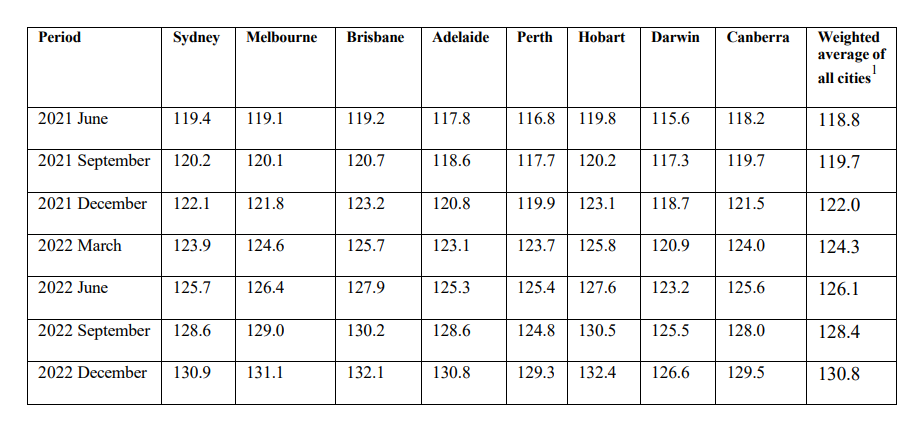
Plot the inflation rate of all major cities in a graph over time. Reflect on the overall trends of inflation rates over time. How do
Plot the inflation rate of all major cities in a graph over time. Reflect on the overall trends of inflation rates over time. How do the cities compare? In your answer, remember to explain the overall trend and to point out the cities with high and low inflation rates over time. Note: Try to explain the trends and fluctuations in the graph. Also, make sure that your graph is of appropriate scale and style to illustrate your discussion
Information needed for answer:


Table 1: CPI of all major cities (all groups); 2011-12 = 100 Period Sydney Melbourne Brisbane Adelaide Perth Hobart Darwin Canberra Weighted average of all cities 2018 September 114.7 114.0 113.4 112.4 110.8 112.2 110.8 112.3 113.5 2018 December 115.2 114.6 114.0 113.0 111.3 113.6 111.0 113.1 114.1 2019 March 115.1 114.7 114.1 113.1 111.2 113.4 110.1 113.2 114.1 2019 June 115.9 115.3 114.8 113.7 112.0 114.1 111.0 113.5 114.8 2019 September 116.5 115.9 115.5 114.5 112.6 114.7 111.3 114.3 115.4 2019 December 117.1 116.9 116.3 115.4 113.1 116.7 111.5 115.0 116.2 2020 March 117.4 117.8 116.2 115.8 113.5 117.2 111.8 115.5 116.6 2020 June 113.7 115.1 113.2 113.6 112.0 114.6 109.2 111.8 113.6 2020 September 116.8 116.7 116.2 115.7 114.1 116.7 110.8 115.4 116.2 2020 December 118.0 118.4 117.5 116.5 113.0 117.6 111.5 116.3 117.2 2021 March 118.5 118.8 118.2 117.2 114.6 118.5 114.4 117.3 117.9
Step by Step Solution
There are 3 Steps involved in it
Step: 1

Get Instant Access to Expert-Tailored Solutions
See step-by-step solutions with expert insights and AI powered tools for academic success
Step: 2

Step: 3

Ace Your Homework with AI
Get the answers you need in no time with our AI-driven, step-by-step assistance
Get Started


