Answered step by step
Verified Expert Solution
Question
1 Approved Answer
Plot the one nine chart of the following 4 data series over the time ( quarter 4,2011 to quarter 4,2019) the historical data series,


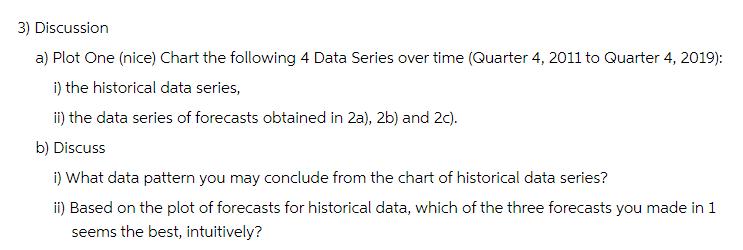
Plot the one nine chart of the following 4 data series over the time ( quarter 4,2011 to quarter 4,2019) the historical data series, Quarter Year Quarter 1 Quarter 2 Quarter 3 Quarter 4 2011 569 131 353 183 2012 492 311 302 124 2013 553 282 419 279 Data 2014 712 267 515 303 Participants 2015 672 460 493 351 2016 631 463 594 366 2017 676 485 503 309 2018 733 472 567 454 2019 847 491 725 477 3) Discussion a) Plot One (nice) Chart the following 4 Data Series over time (Quarter 4, 2011 to Quarter 4, 2019): i) the historical data series, ii) the data series of forecasts obtained in 2a), 2b) and 2c). b) Discuss i) What data pattern you may conclude from the chart of historical data series? ii) Based on the plot of forecasts for historical data, which of the three forecasts you made in 1 seems the best, intuitively?
Step by Step Solution
★★★★★
3.48 Rating (151 Votes )
There are 3 Steps involved in it
Step: 1
The detailed ...
Get Instant Access to Expert-Tailored Solutions
See step-by-step solutions with expert insights and AI powered tools for academic success
Step: 2

Step: 3

Ace Your Homework with AI
Get the answers you need in no time with our AI-driven, step-by-step assistance
Get Started


