

Answered step by step
Verified Expert Solution
Question
1 Approved Answer
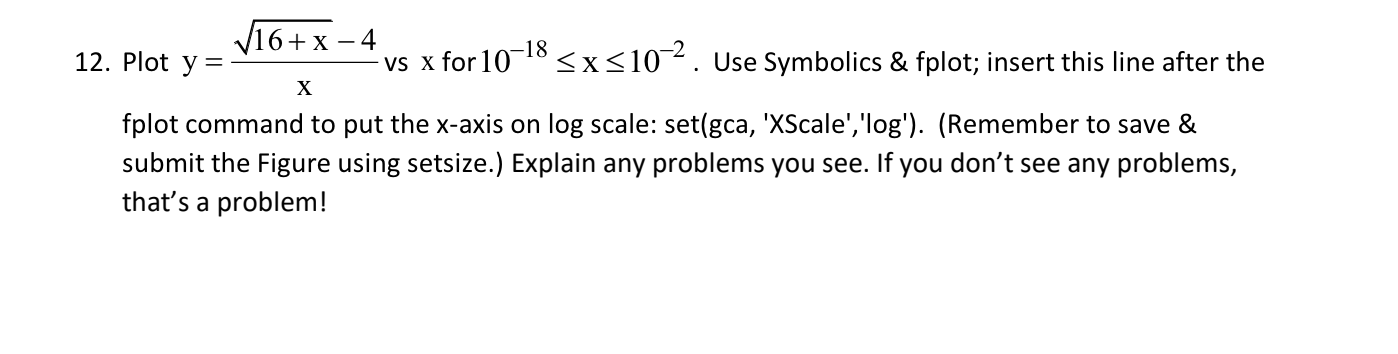
Plot y = 1 6 + x 2 - 4 x vs x for 1 0 - 1 8 x 1 0 - 2 .
Plot vs for Use Symbolics & fplot; insert this line after the
fplot command to put the axis on log scale: setgca 'XScale','log'Remember to save &
submit the Figure using setsize. Explain any problems you see. If you don't see any problems,
that's a problem! USE MATLAB
Step by Step Solution
There are 3 Steps involved in it
Step: 1

Get Instant Access to Expert-Tailored Solutions
See step-by-step solutions with expert insights and AI powered tools for academic success
Step: 2

Step: 3
Ace Your Homework with AI
Get the answers you need in no time with our AI-driven, step-by-step assistance
Get Started
Database And Expert Systems Applications 19th International Conference Dexa 2008 Turin Italy September 2008 Proceedings Lncs 5181
Authors: Sourav S. Bhowmick ,Josef Kung ,Roland Wagner
2008th Edition
3540856536, 978-3540856535