Question
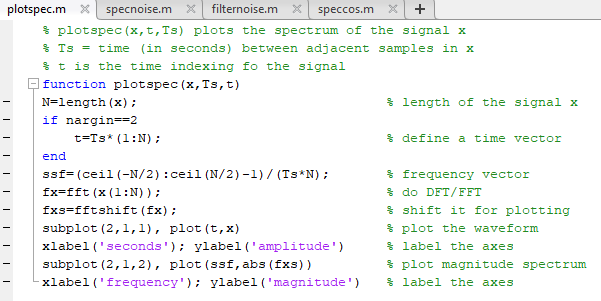
% plotspec(x,t,Ts) plots the spectrum of the signal x % Ts = time (in seconds) between adjacent samples in x % t is the time

% plotspec(x,t,Ts) plots the spectrum of the signal x % Ts = time (in seconds) between adjacent samples in x % t is the time indexing fo the signal function plotspec(x,Ts,t) N=length(x); % length of the signal x if nargin==2 t=Ts*(1:N); % define a time vector end ssf=(ceil(-N/2):ceil(N/2)-1)/(Ts*N); % frequency vector fx=fft(x(1:N)); % do DFT/FFT fxs=fftshift(fx); % shift it for plotting subplot(2,1,1), plot(t,x) % plot the waveform xlabel('seconds'); ylabel('amplitude') % label the axes subplot(2,1,2), plot(ssf,abs(fxs)) % plot magnitude spectrum xlabel('frequency'); ylabel('magnitude') % label the axes

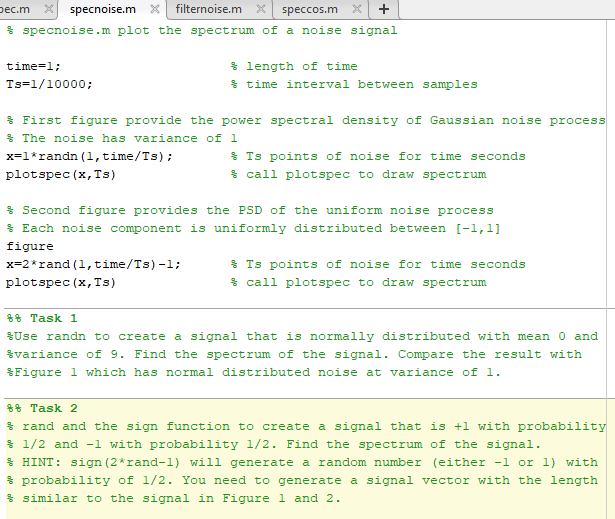
% specnoise.m plot the spectrum of a noise signal
time=1; % length of time Ts=1/10000; % time interval between samples
% First figure provide the power spectral density of Gaussian noise process % The noise has variance of 1 x=1*randn(1,time/Ts); % Ts points of noise for time seconds plotspec(x,Ts) % call plotspec to draw spectrum
% Second figure provides the PSD of the uniform noise process % Each noise component is uniformly distributed between [-1,1] figure x=2*rand(1,time/Ts)-1; % Ts points of noise for time seconds plotspec(x,Ts) % call plotspec to draw spectrum
%% Task 1 %Use randn to create a signal that is normally distributed with mean 0 and %variance of 9. Find the spectrum of the signal. Compare the result with %Figure 1 which has normal distributed noise at variance of 1.
%% Task 2 % rand and the sign function to create a signal that is +1 with probability % 1/2 and -1 with probability 1/2. Find the spectrum of the signal. % HINT: sign(2*rand-1) will generate a random number (either -1 or 1) with % probability of 1/2. You need to generate a signal vector with the length % similar to the signal in Figure 1 and 2.
% plotspec(x,t,Ts) plots the spectrum of the signal x % Ts time (in seconds) between adjacent samples in x % t is the time indexing fo the signal function plotspec (x, Ts, t) N-length (x); if nargin--2 % length of the signal x t=Ts* (1 : N) ; % define a time vector ssf- (ceil (-N/2) :ceil (N/2)-1)/(Ts N) fx-fft (x (1N)) fxs-fftshift (fx) subplot (2,1,1), plot (t, x) xlabel 'seconds' ylabel('amplitude') subplot (2,1,2), plot (ssf,abs (fxs)) xlabel (' frequency'); ylabel ('magnitude') % frequency vector % do DFT/FFT % shift it for plotting % plot the waveform label the axes % plot magnitude spectrum % label the axes % specnoise.m plot the spectrum of a noise signal time-l, % length of time % time interval between samples Ts-1/10000 % First figure provide the power spectral density of Gaussian noise process The noise has variance x=1 * randn (1, time/Ts) ; plotspec (x, Ts) oI I % Ts points of noise for time seconds % call plotspec to draw spectrum % second figure provides the PSD of the uniform noise process % Each noise component is uniformly distributed between [-1,1] figure x-2*rand (1,time/Ts) -1; plotspec (x, Ts) % Ts points of noise for time seconds % call plotspec to draw spectrum %% Task 1 %Use randn to create a signal that is normally distributed with mean 0 and %variance of 9. Find the spectrum of the signal. Compare the result with %Figure 1 which has normal distributed noise at variance of 1. %% Task 2 % rand and the sign function to create a signal that is +1 with probability % l/2 and-1 with probability 1/2. Find the spectrum of the signal. % HINT : sign (2-rand-1) will generate a random number (either -1 or 1) with % probability of I/2. You need to generate a signal vector with the length % similar to the signal in Figure 1 and 2Step by Step Solution
There are 3 Steps involved in it
Step: 1

Get Instant Access to Expert-Tailored Solutions
See step-by-step solutions with expert insights and AI powered tools for academic success
Step: 2

Step: 3

Ace Your Homework with AI
Get the answers you need in no time with our AI-driven, step-by-step assistance
Get Started


