Answered step by step
Verified Expert Solution
Question
1 Approved Answer
Plotted above is a dataset of one-dimensional samples from two classes. Within that dataset: Sample 1: x=[5],y=1 Sample 2: x=[1],y=+1 Sample 3: x=[4],y=1 Q3 (1pt):
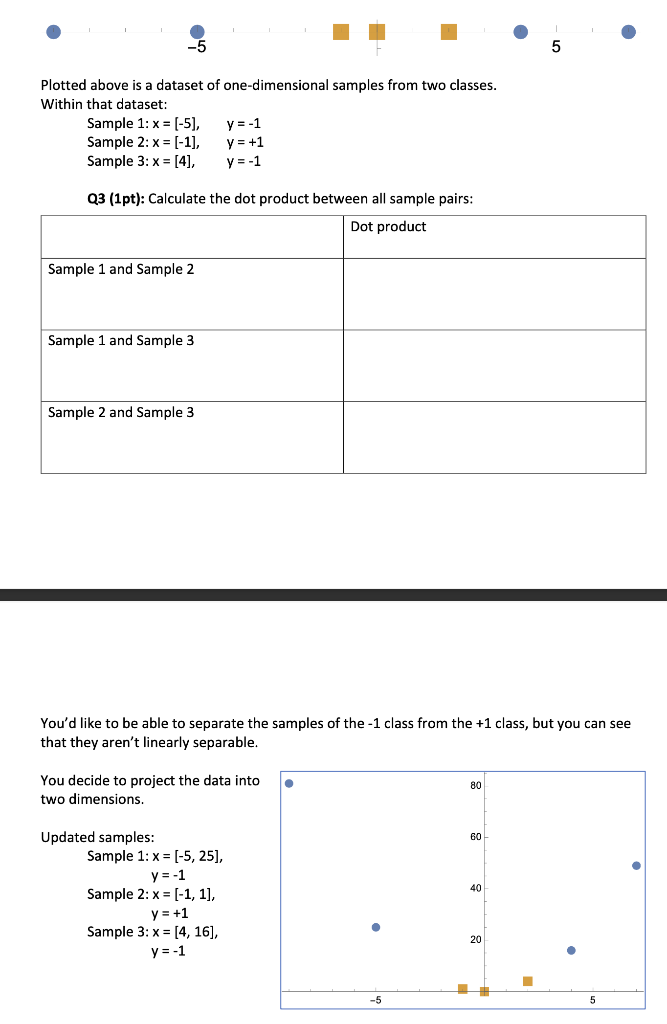
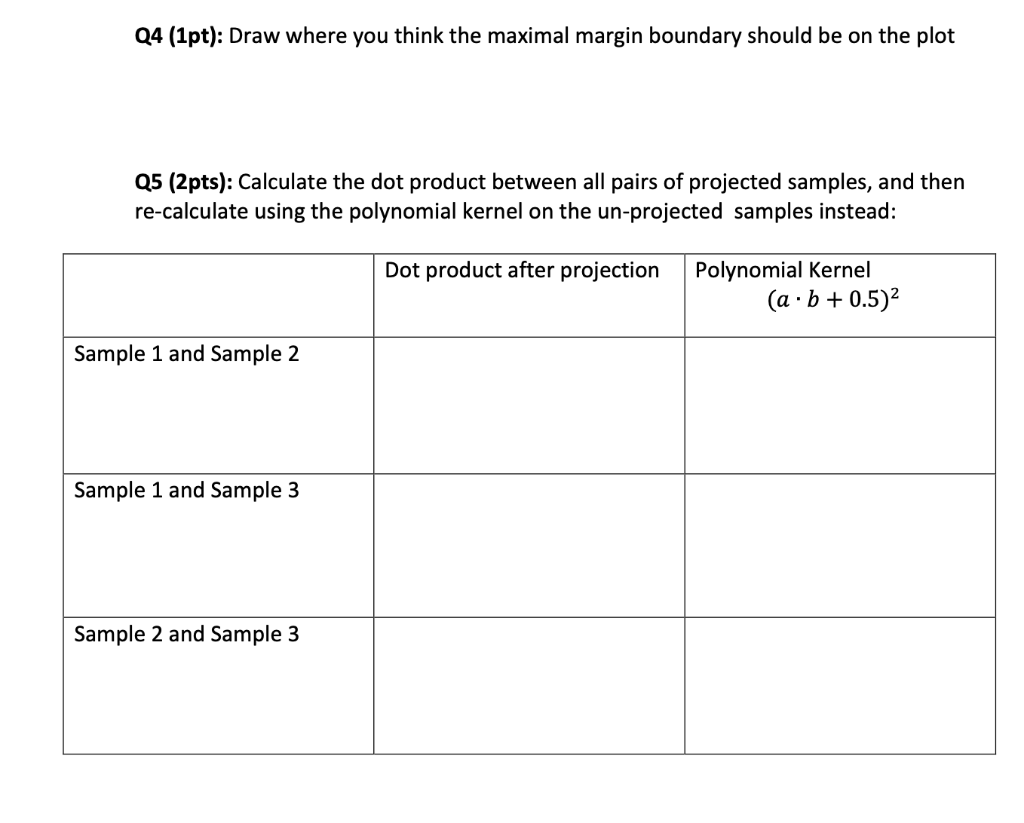
Plotted above is a dataset of one-dimensional samples from two classes. Within that dataset: Sample 1: x=[5],y=1 Sample 2: x=[1],y=+1 Sample 3: x=[4],y=1 Q3 (1pt): Calculate the dot product between all sample pairs: You'd like to be able to separate the samples of the 1 class from the +1 class, but you can see that they aren't linearly separable. You decide to project the data into two dimensions. Updated samples: Sample 1: x=[5,25], y=1 Sample 2: x=[1,1] y=+1 Sample 3: x=[4,16], y=1 Q4 (1pt): Draw where you think the maximal margin boundary should be on the plot Q5 (2pts): Calculate the dot product between all pairs of projected samples, and then re-calculate using the polynomial kernel on the un-projected samples instead
Step by Step Solution
There are 3 Steps involved in it
Step: 1
Get Instant Access to Expert-Tailored Solutions
See step-by-step solutions with expert insights and AI powered tools for academic success
Step: 2
Step: 3
Ace Your Homework with AI
Get the answers you need in no time with our AI-driven, step-by-step assistance
Get Started