pls i need this today
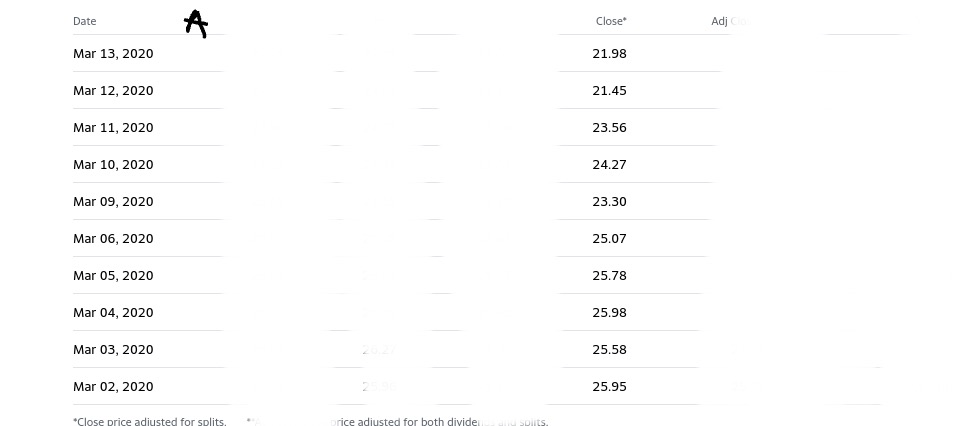
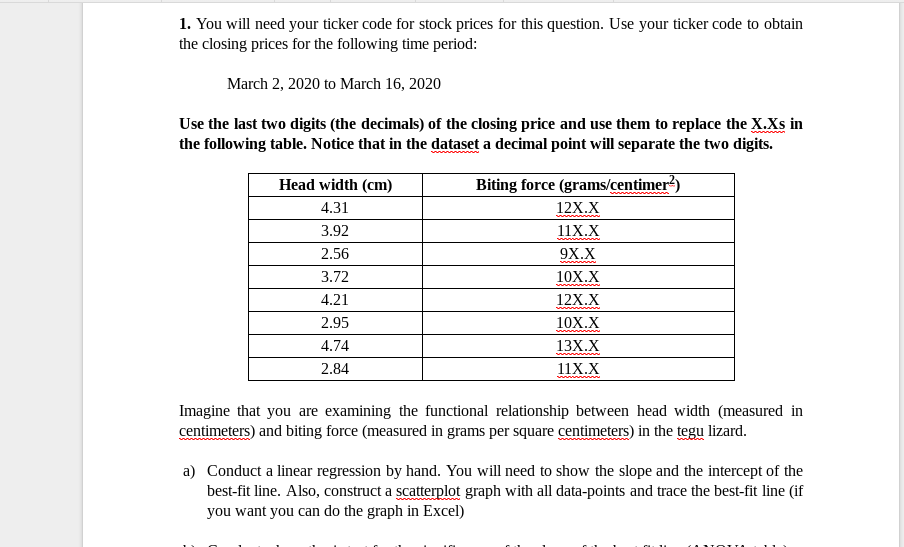
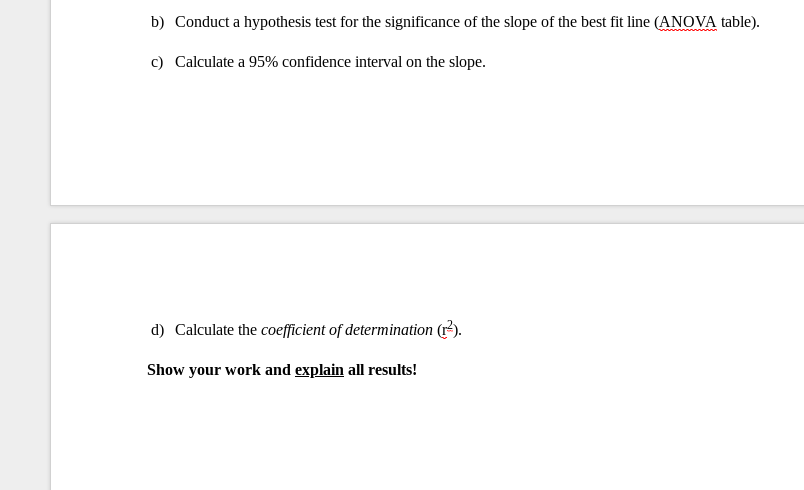
Date A Close* Adj Clo Mar 13, 2020 21.98 Mar 12, 2020 21.45 Mar 11, 2020 23.56 Mar 10, 2020 24.27 Mar 09, 2020 23.30 Mar 06, 2020 25.07 Mar 05, 2020 25.78 Mar 04, 2020 25.98 Mar 03, 2020 25.58 Mar 02, 2020 25.95 price adjusted for splits rice adjusted for both divideDate A Close* Adj Clo Mar 13, 2020 21.98 Mar 12, 2020 21.45 Mar 11, 2020 23.56 Mar 10, 2020 24.27 Mar 09, 2020 23.30 Mar 06, 2020 25.07 Mar 05, 2020 25.78 Mar 04, 2020 25.98 Mar 03, 2020 25.58 Mar 02, 2020 25.95 price adjusted for splits rice adjusted for both divide1. You will need your ticker code for stock prices for this question. Use your ticker code to obtain the closing prices for the following time period: March 2, 202C! to March 15, 2020 Use the last two digits {the decimals) of the closing price and use them to replace the X15 ill the following table. Notice that ill the dataset a decimal point will separate the two digits. Head width (an) Biting fome {grant-musing) 4.31 m 3.92 $152.3. 2.55 9252.3. 3.72 m 4.21 1.2.5.4311. 2.95 1925.911. 4.74 1.335.911. 2.34 $3.93. Imagine that you are examining the functional relationship between head width {measured in centimeters) and biting force [measured in grams per square centimeters} in the tegu lizard. a) Conduct a linear regression by hand. You will need to show the slope and the intercept of the bestt line. Also, construct a scattegplot graph with all datapoints and trace the bestt line {if you want you can do the graph in Excel) b) Conduct a hypothesis test for the significance of the slope of the best fit line (ANOVA table). c) Calculate a 95% confidence interval on the slope. d) Calculate the coefficient of determination (). Show your work and explain all results