Answered step by step
Verified Expert Solution
Question
1 Approved Answer
pls pls pls answer my question. I dont understand. pls pls pls pls help me solve this excericise. I dont understand. Exercise Ch3-2-A: Level 2
pls pls pls answer my question. I dont understand. 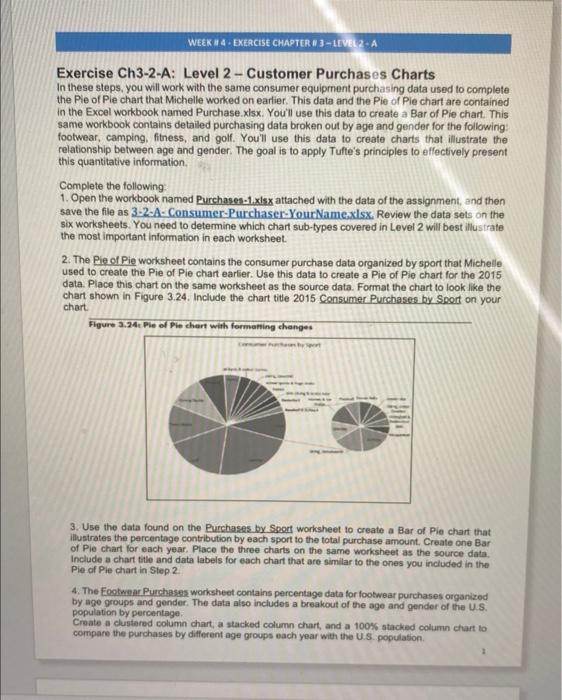


pls pls pls pls help me solve this excericise. I dont understand. 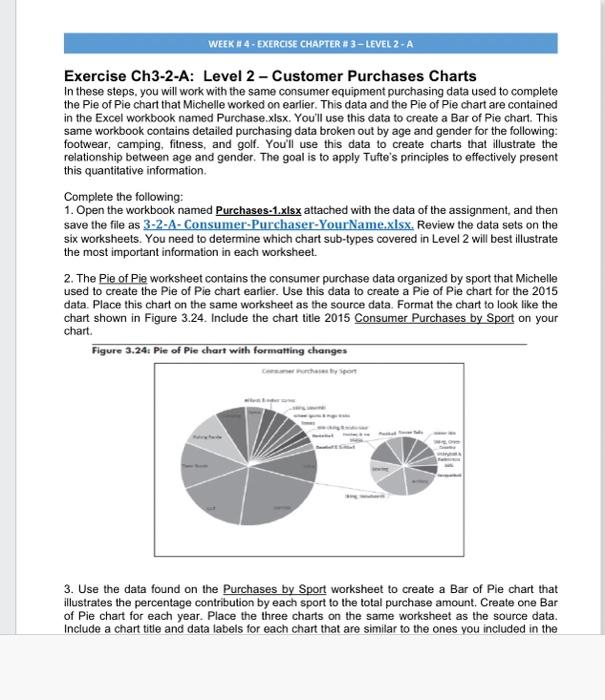
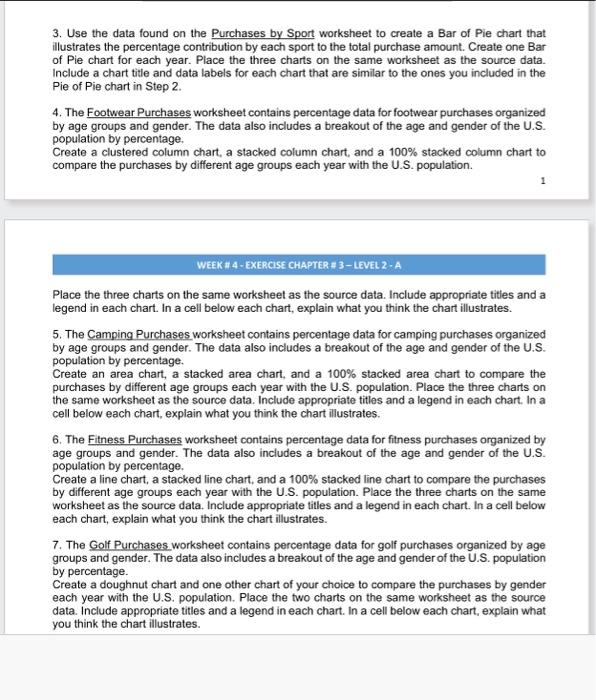
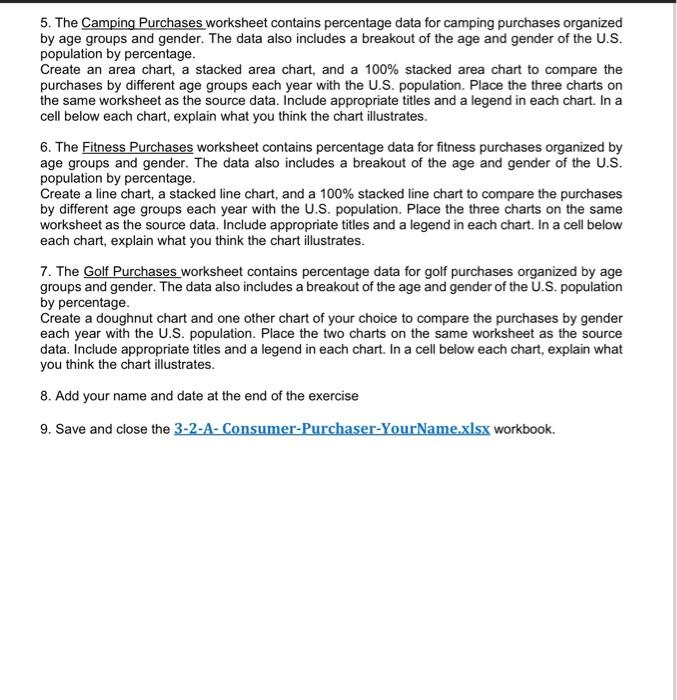
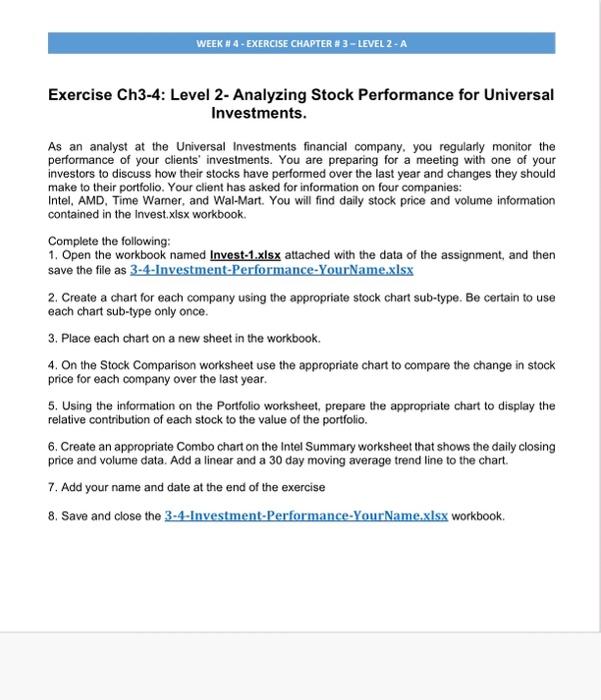
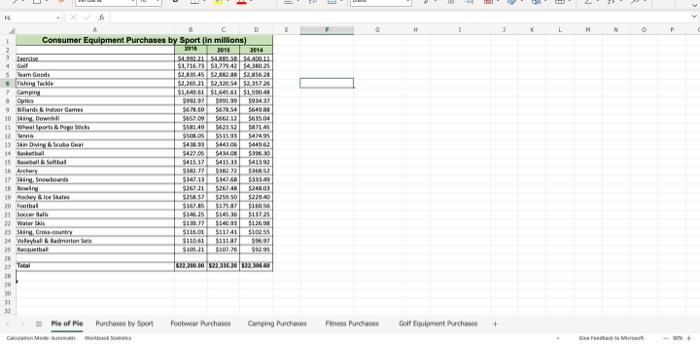
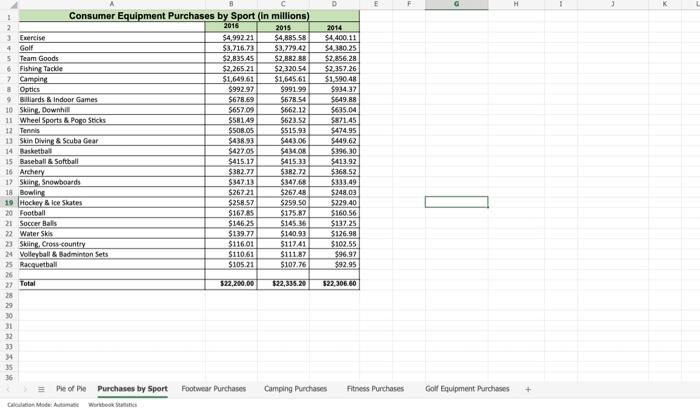
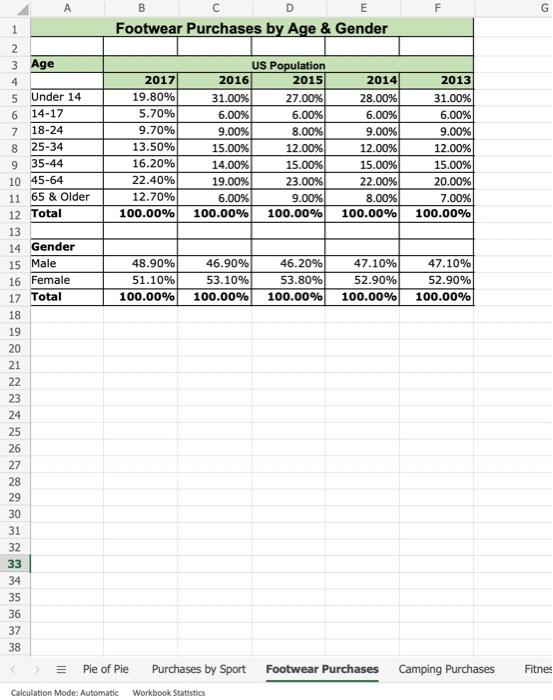
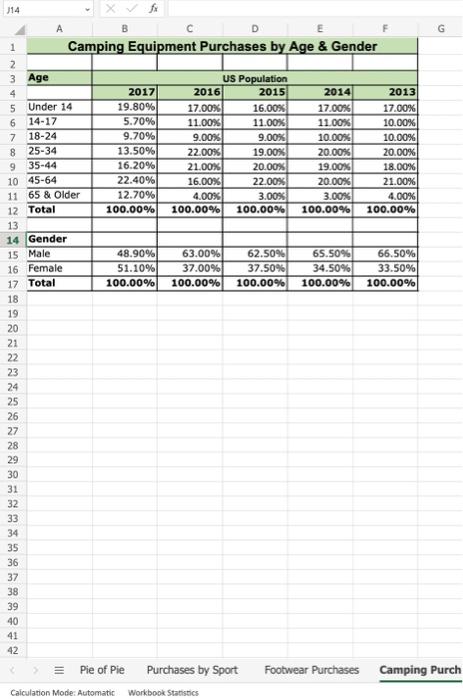
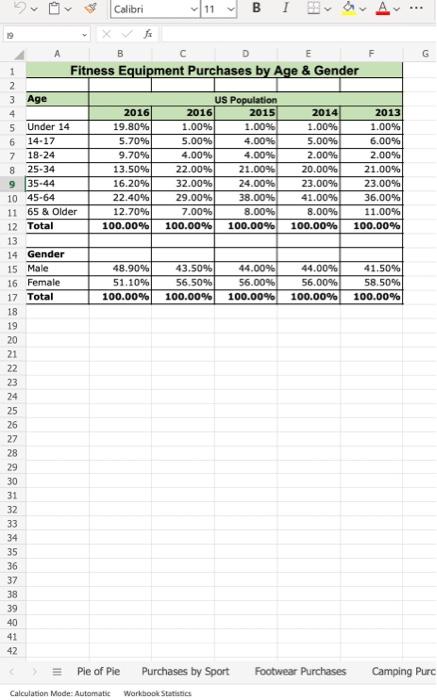
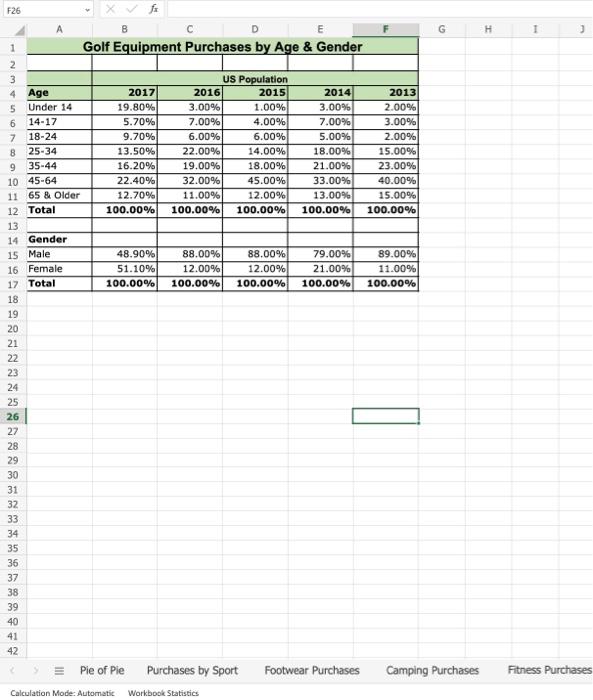
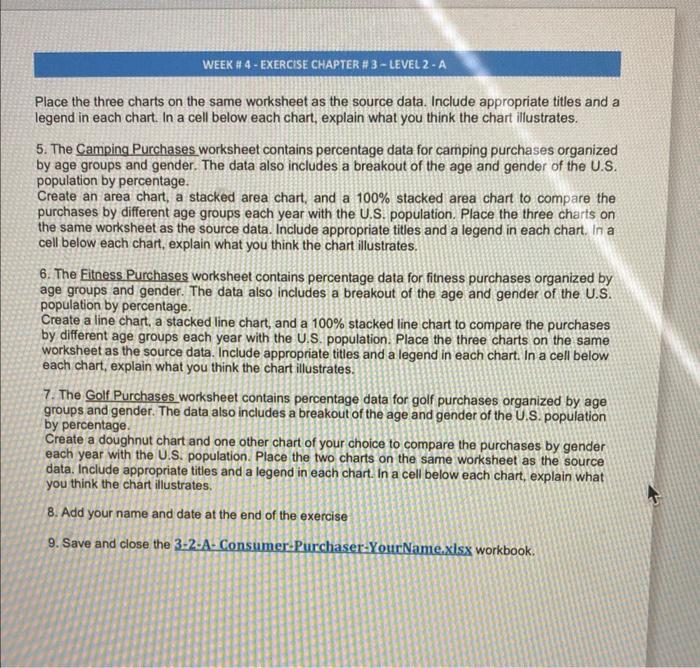
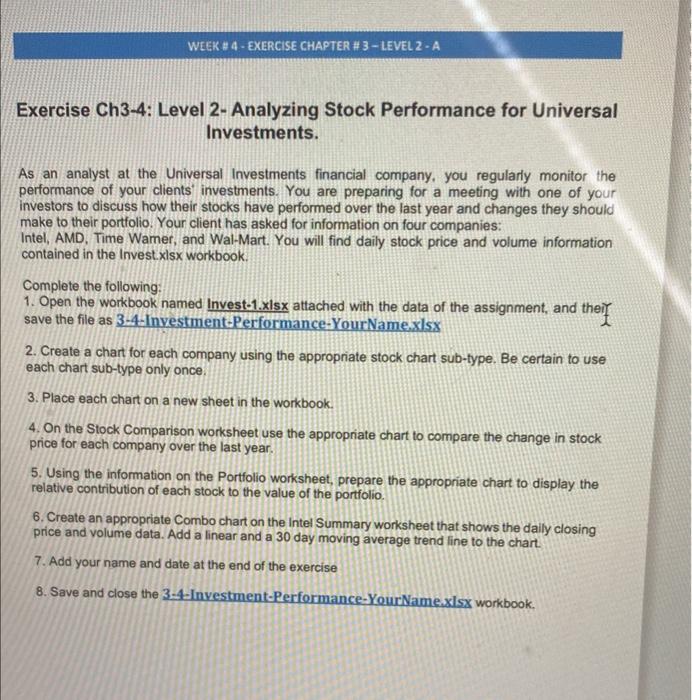
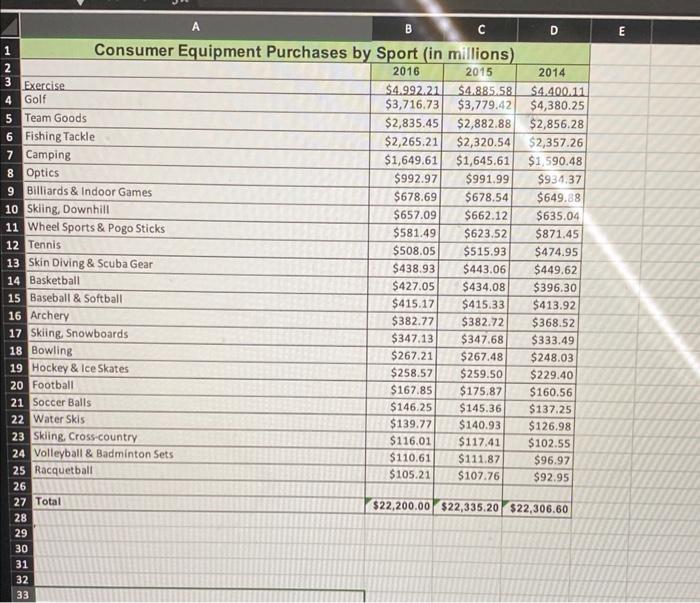
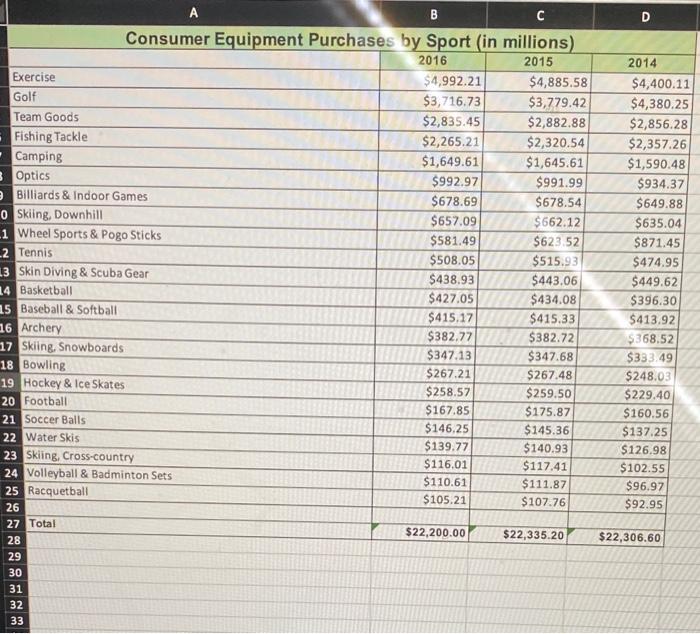
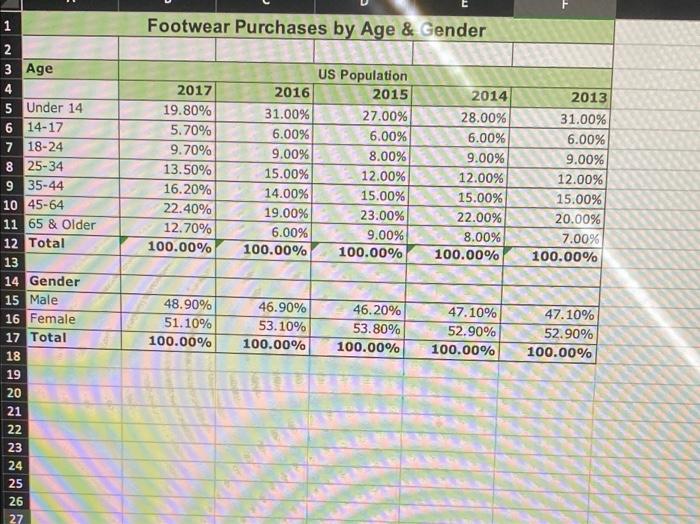
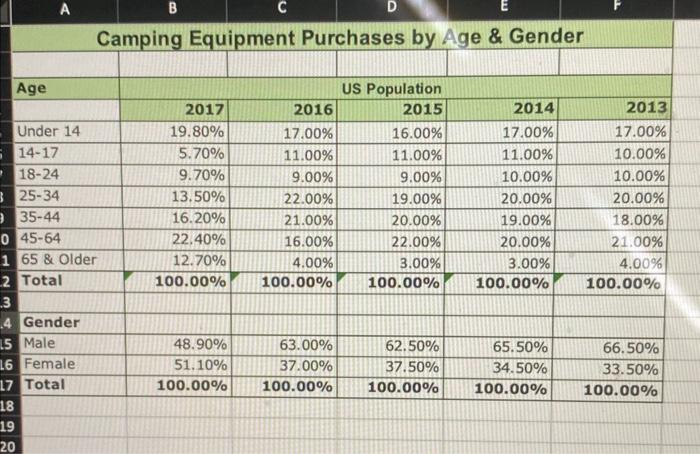
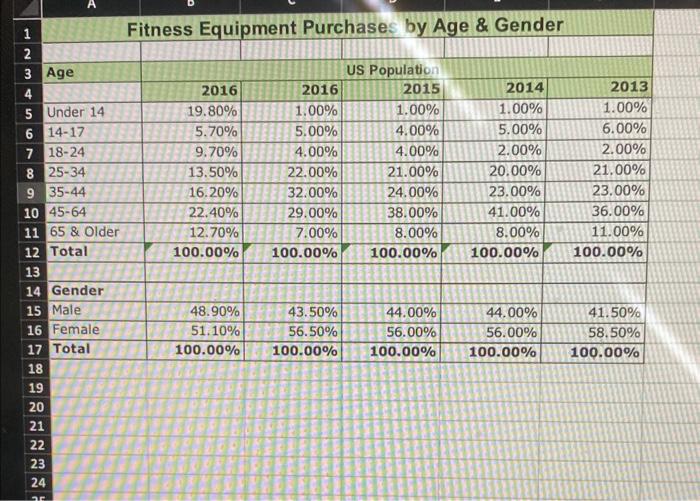
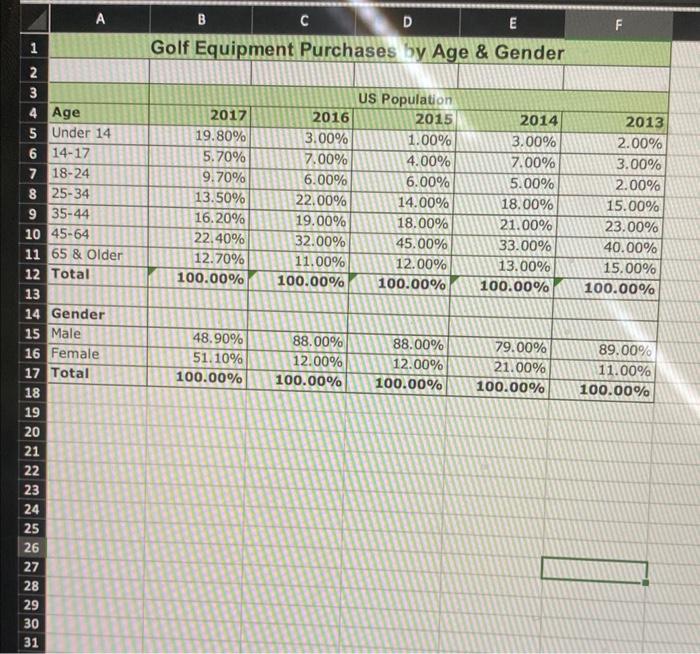
Exercise Ch3-2-A: Level 2 - Customer Purchases Charts In these steps, you will work with the same consumer equipment purchasing data used to complete the Pie of Ple chart that Michelle worked on earlier. This data and the Pie of Ple chart are contained in the Excel workbook named Purchase.xlsx. You'll use this data to create a Bar of Pie chart. This same workbook contains detailed purchasing data broken out by age and gender for the following: footwear, camping. fitness, and golf. You'll use this data to create charts that illustrate the relationship between age and gender. The goal is to apply Tufte's principles to effectively present this quantitative information. Complete the following: 1. Open the workbook named Rurchases-1, x is x attached with the data of the assignment, and then save the file as 3-2-A-Consumer-Purchaser-YourNamexlsx. Review the data sets on the six worksheets. You need to determine which chart sub-types covered in Level 2 will best illustrate the most important information in each worksheet. 2. The Pie of Pie worksheet contains the consumer purchase data organized by sport that Michelle used to create the Pie of Pie chart eartier. Use this data to create a Pie of Pie chart for the 2015 data. Place this chart on the same worksheet as the source data. Format the chart to look like the chart shown in Figure 3.24. Include the chart title 2015 Consumer Purchases by Sport on your chart. Flgure 3.24t Pie of Ple chart with fermantina chanaes 3. Use the data found on the Purchases by Sport worksheet to create a Bar of Pie chart that illustrates the percentage contribution by each sport to the total purchase amount. Create one Bar of Pie chart for each year. Place the three charts on the same worksheet as the source data. include a chart title and data labels for each chart that are similar to the ones you included in the Pie of Pie chart in Step 2 . 4. The Eootwear Purchases worksheet contains percentage data for footwear purchases organized by age groups and gender. The data also includes a breakout of the age and gender of the U.S. population by percentage. Create a clustered column chart, a stacked column chart, and a 100% stacked column chart to compare the purchases by different age groups each year with the U.S. population. legend in each chart. In a cell below each chart, explain what you think the chart illustrates. 5. The Camping Purchases worksheet contains percentage data for camping purchases organized by age groups and gender. The data also includes a breakout of the age and gender of the U.S. population by percentage. Create an area chart, a stacked area chart, and a 100% stacked area chart to compare the purchases by different age groups each year with the U.S. population. Place the three charts on the same worksheet as the source data. Include appropriate titles and a legend in each chart. In a cell below each chart, explain what you think the chart illustrates. 6. The Eitness Purchases worksheet contains percentage data for fitness purchases organized by age groups and gender. The data also includes a breakout of the age and gender of the U.S. population by percentage. Create a line chart, a stacked line chart, and a 100% stacked line chart to compare the purchases by different age groups each year with the U.S. population. Place the three charts on the same worksheet as the source data. Include appropriate titles and a legend in each chart. In a cell below each chart, explain what you think the chart illustrates. 7. The Golf Purchases worksheet contains percentage data for golf purchases organized by age groups and gender. The data also includes a breakout of the age and gender of the U.S. population by percentage. Create a doughnut chart and one other chart of your choice to compare the purchases by gender each year with the U.S. population. Place the two charts on the same worksheet as the source data. Include appropriate titles and a legend in each chart. In a cell below each chart, explain what you think the chart illustrates. 8. Add your name and date at the end of the exercise Exercise Ch3-4: Level 2-Analyzing Stock Performance for Universal Investments. As an analyst at the Universal Investments financial company, you regularly monitor the performance of your clients investments. You are preparing for a meeting with one of your investors to discuss how their stocks have performed over the last year and changes they should make to their portfolio. Your client has asked for information on four companies: Intel, AMD, Time Wamer, and Wal-Mart. You will find daily stock price and volume information contained in the Invest x Is x workbook. Complete the following: 1. Open the workbook named Invest-1. xsx attached with the data of the assignment, and theif save the file as 3 -4-Investment-Performance-YourName x s 5 X 2. Create a chart for each company using the appropriate stock chart sub-type. Be certain to use each chart sub-type only once. 3. Place each chart on a new sheet in the workbook. 4. On the Stock Comparison worksheet use the appropriate chart to compare the change in stock price for each company over the last year. 5. Using the information on the Portfolio worksheet, prepare the appropriate chart to display the relative contribution of each stock to the value of the portfolio. 6. Create an appropriate Combo chart on the Intel Summary worksheet that shows the daily closing price and volume data. Add a linear and a 30 day moving average trend line to the chart. 7. Add your name and date at the end of the exercise 8. Save and close the 3-4-Investment-Performance-YourName.xlsX workbook. A Consumer Equipment Purchases by Sport (in millions) Exercise Golf Team Goods Fishing Tackle Camping Optics Billiards \& Indoor Games 0 Skiing, Downhill 1 Wheel Sports \& Pogo Sticks 2 Tennis 3 Skin Diving \& Scuba Gear 14 Basketball 15 Baseball \& Softball 16 Archery 17 Skiing, Snowboards 18 Bowling 19 Hockey \& Ice Skates 20 Football 21 Soccer Balls 22 Water Skis 23 Skiing, Cross-country 24 Volleyball \& Badminton Sets 25 Racquetball 26 Footwear Purchases by Age \& Gender A B Camping Equipment Purchases by Age \& Gender Eitness Equipment Purchases by Age \& Gende Exercise Ch3-2-A: Level 2 - Customer Purchases Charts In these steps, you will work with the same consumer equipment purchasing data used to complete the Pie of Pie chart that Michelle worked on earlier. This data and the Pie of Pie chart are contained in the Excel workbook named Purchase.xlsx. You'll use this data to create a Bar of Pie chart. This same workbook contains detailed purchasing data broken out by age and gender for the following: footwear, camping, fitness, and golf. You'll use this data to create charts that illustrate the relationship between age and gender. The goal is to apply Tufte's principles to effectively present this quantitative information. Complete the following: 1. Open the workbook named Purchases-1.xlsx attached with the data of the assignment, and then save the file as 32A-A-Consumer-Purchaser-YourName.xlsx. Review the data sets on the six worksheets. You need to determine which chart sub-types covered in Level 2 will best illustrate the most important information in each worksheet. 2. The Pie of Pie worksheet contains the consumer purchase data organized by sport that Michelle used to create the Pie of Pie chart earlier. Use this data to create a Pie of Pie chart for the 2015 data. Place this chart on the same worksheet as the source data. Format the chart to look like the chart shown in Figure 3.24. Include the chart title 2015 Consumer Purchases by Sport on your chart. Figure 3.24: Die af Dien shart with formantion shassons 3. Use the data found on the Purchases by Sport worksheet to create a Bar of Pie chart that illustrates the percentage contribution by each sport to the total purchase amount. Create one Bar of Pie chart for each year. Place the three charts on the same worksheet as the source data. Include a chart title and data labels for each chart that are similar to the ones you included in the 3. Use the data found on the Purchases by Sport worksheet to create a Bar of Pie chart that illustrates the percentage contribution by each sport to the total purchase amount. Create one Bar of Pie chart for each year. Place the three charts on the same worksheet as the source data. Include a chart title and data labels for each chart that are similar to the ones you included in the Pie of Pie chart in Step 2. 4. The Footwear Purchases worksheet contains percentage data for footwear purchases organized by age groups and gender. The data also includes a breakout of the age and gender of the U.S. population by percentage. Create a clustered column chart, a stacked column chart, and a 100% stacked column chart to compare the purchases by different age groups each year with the U.S. population. 1 WEEK H 4 - EXERCISE CHAPTER \# 3 - LEVEL 2 - A Place the three charts on the same worksheet as the source data. Include appropriate titles and a legend in each chart. In a cell below each chart, explain what you think the chart illustrates. 5. The Camping Purchases worksheet contains percentage data for camping purchases organized by age groups and gender. The data also includes a breakout of the age and gender of the U.S. population by percentage. Create an area chart, a stacked area chart, and a 100% stacked area chart to compare the purchases by different age groups each year with the U.S. population. Place the three charts on the same worksheet as the source data. Include appropriate titles and a legend in each chart. In a cell below each chart, explain what you think the chart illustrates. 6. The Fitness Purchases worksheet contains percentage data for fitness purchases organized by age groups and gender. The data also includes a breakout of the age and gender of the U.S. population by percentage. Create a line chart, a stacked line chart, and a 100% stacked line chart to compare the purchases by different age groups each year with the U.S. population. Place the three charts on the same worksheet as the source data. Include appropriate titles and a legend in each chart. In a cell below each chart, explain what you think the chart illustrates. 7. The Golf Purchases.worksheet contains percentage data for golf purchases organized by age groups and gender. The data also includes a breakout of the age and gender of the U.S. population by percentage. Create a doughnut chart and one other chart of your choice to compare the purchases by gender each year with the U.S. population. Place the two charts on the same worksheet as the source data. Include appropriate titles and a legend in each chart. In a cell below each chart, explain what you think the chart illustrates. 5. The Camping Purchases worksheet contains percentage data for camping purchases organized by age groups and gender. The data also includes a breakout of the age and gender of the U.S. population by percentage. Create an area chart, a stacked area chart, and a 100% stacked area chart to compare the purchases by different age groups each year with the U.S. population. Place the three charts on the same worksheet as the source data. Include appropriate titles and a legend in each chart. In a cell below each chart, explain what you think the chart illustrates. 6. The Fitness Purchases worksheet contains percentage data for fitness purchases organized by age groups and gender. The data also includes a breakout of the age and gender of the U.S. population by percentage. Create a line chart, a stacked line chart, and a 100% stacked line chart to compare the purchases by different age groups each year with the U.S. population. Place the three charts on the same worksheet as the source data. Include appropriate titles and a legend in each chart. In a cell below each chart, explain what you think the chart illustrates. 7. The Golf Purchases worksheet contains percentage data for golf purchases organized by age groups and gender. The data also includes a breakout of the age and gender of the U.S. population by percentage. Create a doughnut chart and one other chart of your choice to compare the purchases by gender each year with the U.S. population. Place the two charts on the same worksheet as the source data. Include appropriate titles and a legend in each chart. In a cell below each chart, explain what you think the chart illustrates. 8. Add your name and date at the end of the exercise 9. Save and close the 3-2-A-Consumer-Purchaser-YourName.xlsX workbook. Exercise Ch3-4: Level 2- Analyzing Stock Performance for Universal Investments. As an analyst at the Universal Investments financial company, you regularly monitor the performance of your clients' investments. You are preparing for a meeting with one of your investors to discuss how their stocks have performed over the last year and changes they should make to their portfolio. Your client has asked for information on four companies: Intel, AMD, Time Warner, and Wal-Mart. You will find daily stock price and volume information contained in the Invest.xlsx workbook. Complete the following: 1. Open the workbook named Invest-1.xIsx attached with the data of the assignment, and then save the file as 3-4-Investment-Performance-YourName. x Isx 2. Create a chart for each company using the appropriate stock chart sub-type. Be certain to use each chart sub-type only once. 3. Place each chart on a new sheet in the workbook. 4. On the Stock Comparison worksheet use the appropriate chart to compare the change in stock price for each company over the last year. 5. Using the information on the Portfolio worksheet, prepare the appropriate chart to display the relative contribution of each stock to the value of the portfolio. 6. Create an appropriate Combo chart on the Intel Summary worksheet that shows the daily closing price and volume data. Add a linear and a 30 day moving average trend line to the chart. 7. Add your name and date at the end of the exercise 8. Save and close the 3-4-Investment-Performance-YourName.xlsx workbook. Pie of Pie Purchases by Sport Footwar Purchases Camping Purchases Atness Purchases Colr Equipment Purchases + 18 19 20 21 22 23 24 25 26 27 28 29 30 31 32 33 34 35 36 37 38 39 40 41 42 18 19 20 21 22 23 24 25 26 27 28 29 30 31 32 33 34 35 36 37 38 39 40 41 42 Exercise Ch3-2-A: Level 2 - Customer Purchases Charts In these steps, you will work with the same consumer equipment purchasing data used to complete the Pie of Ple chart that Michelle worked on earlier. This data and the Pie of Ple chart are contained in the Excel workbook named Purchase.xlsx. You'll use this data to create a Bar of Pie chart. This same workbook contains detailed purchasing data broken out by age and gender for the following: footwear, camping. fitness, and golf. You'll use this data to create charts that illustrate the relationship between age and gender. The goal is to apply Tufte's principles to effectively present this quantitative information. Complete the following: 1. Open the workbook named Rurchases-1, x is x attached with the data of the assignment, and then save the file as 3-2-A-Consumer-Purchaser-YourNamexlsx. Review the data sets on the six worksheets. You need to determine which chart sub-types covered in Level 2 will best illustrate the most important information in each worksheet. 2. The Pie of Pie worksheet contains the consumer purchase data organized by sport that Michelle used to create the Pie of Pie chart eartier. Use this data to create a Pie of Pie chart for the 2015 data. Place this chart on the same worksheet as the source data. Format the chart to look like the chart shown in Figure 3.24. Include the chart title 2015 Consumer Purchases by Sport on your chart. Flgure 3.24t Pie of Ple chart with fermantina chanaes 3. Use the data found on the Purchases by Sport worksheet to create a Bar of Pie chart that illustrates the percentage contribution by each sport to the total purchase amount. Create one Bar of Pie chart for each year. Place the three charts on the same worksheet as the source data. include a chart title and data labels for each chart that are similar to the ones you included in the Pie of Pie chart in Step 2 . 4. The Eootwear Purchases worksheet contains percentage data for footwear purchases organized by age groups and gender. The data also includes a breakout of the age and gender of the U.S. population by percentage. Create a clustered column chart, a stacked column chart, and a 100% stacked column chart to compare the purchases by different age groups each year with the U.S. population. legend in each chart. In a cell below each chart, explain what you think the chart illustrates. 5. The Camping Purchases worksheet contains percentage data for camping purchases organized by age groups and gender. The data also includes a breakout of the age and gender of the U.S. population by percentage. Create an area chart, a stacked area chart, and a 100% stacked area chart to compare the purchases by different age groups each year with the U.S. population. Place the three charts on the same worksheet as the source data. Include appropriate titles and a legend in each chart. In a cell below each chart, explain what you think the chart illustrates. 6. The Eitness Purchases worksheet contains percentage data for fitness purchases organized by age groups and gender. The data also includes a breakout of the age and gender of the U.S. population by percentage. Create a line chart, a stacked line chart, and a 100% stacked line chart to compare the purchases by different age groups each year with the U.S. population. Place the three charts on the same worksheet as the source data. Include appropriate titles and a legend in each chart. In a cell below each chart, explain what you think the chart illustrates. 7. The Golf Purchases worksheet contains percentage data for golf purchases organized by age groups and gender. The data also includes a breakout of the age and gender of the U.S. population by percentage. Create a doughnut chart and one other chart of your choice to compare the purchases by gender each year with the U.S. population. Place the two charts on the same worksheet as the source data. Include appropriate titles and a legend in each chart. In a cell below each chart, explain what you think the chart illustrates. 8. Add your name and date at the end of the exercise Exercise Ch3-4: Level 2-Analyzing Stock Performance for Universal Investments. As an analyst at the Universal Investments financial company, you regularly monitor the performance of your clients investments. You are preparing for a meeting with one of your investors to discuss how their stocks have performed over the last year and changes they should make to their portfolio. Your client has asked for information on four companies: Intel, AMD, Time Wamer, and Wal-Mart. You will find daily stock price and volume information contained in the Invest x Is x workbook. Complete the following: 1. Open the workbook named Invest-1. xsx attached with the data of the assignment, and theif save the file as 3 -4-Investment-Performance-YourName x s 5 X 2. Create a chart for each company using the appropriate stock chart sub-type. Be certain to use each chart sub-type only once. 3. Place each chart on a new sheet in the workbook. 4. On the Stock Comparison worksheet use the appropriate chart to compare the change in stock price for each company over the last year. 5. Using the information on the Portfolio worksheet, prepare the appropriate chart to display the relative contribution of each stock to the value of the portfolio. 6. Create an appropriate Combo chart on the Intel Summary worksheet that shows the daily closing price and volume data. Add a linear and a 30 day moving average trend line to the chart. 7. Add your name and date at the end of the exercise 8. Save and close the 3-4-Investment-Performance-YourName.xlsX workbook. A Consumer Equipment Purchases by Sport (in millions) Exercise Golf Team Goods Fishing Tackle Camping Optics Billiards \& Indoor Games 0 Skiing, Downhill 1 Wheel Sports \& Pogo Sticks 2 Tennis 3 Skin Diving \& Scuba Gear 14 Basketball 15 Baseball \& Softball 16 Archery 17 Skiing, Snowboards 18 Bowling 19 Hockey \& Ice Skates 20 Football 21 Soccer Balls 22 Water Skis 23 Skiing, Cross-country 24 Volleyball \& Badminton Sets 25 Racquetball 26 Footwear Purchases by Age \& Gender A B Camping Equipment Purchases by Age \& Gender Eitness Equipment Purchases by Age \& Gende Exercise Ch3-2-A: Level 2 - Customer Purchases Charts In these steps, you will work with the same consumer equipment purchasing data used to complete the Pie of Pie chart that Michelle worked on earlier. This data and the Pie of Pie chart are contained in the Excel workbook named Purchase.xlsx. You'll use this data to create a Bar of Pie chart. This same workbook contains detailed purchasing data broken out by age and gender for the following: footwear, camping, fitness, and golf. You'll use this data to create charts that illustrate the relationship between age and gender. The goal is to apply Tufte's principles to effectively present this quantitative information. Complete the following: 1. Open the workbook named Purchases-1.xlsx attached with the data of the assignment, and then save the file as 32A-A-Consumer-Purchaser-YourName.xlsx. Review the data sets on the six worksheets. You need to determine which chart sub-types covered in Level 2 will best illustrate the most important information in each worksheet. 2. The Pie of Pie worksheet contains the consumer purchase data organized by sport that Michelle used to create the Pie of Pie chart earlier. Use this data to create a Pie of Pie chart for the 2015 data. Place this chart on the same worksheet as the source data. Format the chart to look like the chart shown in Figure 3.24. Include the chart title 2015 Consumer Purchases by Sport on your chart. Figure 3.24: Die af Dien shart with formantion shassons 3. Use the data found on the Purchases by Sport worksheet to create a Bar of Pie chart that illustrates the percentage contribution by each sport to the total purchase amount. Create one Bar of Pie chart for each year. Place the three charts on the same worksheet as the source data. Include a chart title and data labels for each chart that are similar to the ones you included in the 3. Use the data found on the Purchases by Sport worksheet to create a Bar of Pie chart that illustrates the percentage contribution by each sport to the total purchase amount. Create one Bar of Pie chart for each year. Place the three charts on the same worksheet as the source data. Include a chart title and data labels for each chart that are similar to the ones you included in the Pie of Pie chart in Step 2. 4. The Footwear Purchases worksheet contains percentage data for footwear purchases organized by age groups and gender. The data also includes a breakout of the age and gender of the U.S. population by percentage. Create a clustered column chart, a stacked column chart, and a 100% stacked column chart to compare the purchases by different age groups each year with the U.S. population. 1 WEEK H 4 - EXERCISE CHAPTER \# 3 - LEVEL 2 - A Place the three charts on the same worksheet as the source data. Include appropriate titles and a legend in each chart. In a cell below each chart, explain what you think the chart illustrates. 5. The Camping Purchases worksheet contains percentage data for camping purchases organized by age groups and gender. The data also includes a breakout of the age and gender of the U.S. population by percentage. Create an area chart, a stacked area chart, and a 100% stacked area chart to compare the purchases by different age groups each year with the U.S. population. Place the three charts on the same worksheet as the source data. Include appropriate titles and a legend in each chart. In a cell below each chart, explain what you think the chart illustrates. 6. The Fitness Purchases worksheet contains percentage data for fitness purchases organized by age groups and gender. The data also includes a breakout of the age and gender of the U.S. population by percentage. Create a line chart, a stacked line chart, and a 100% stacked line chart to compare the purchases by different age groups each year with the U.S. population. Place the three charts on the same worksheet as the source data. Include appropriate titles and a legend in each chart. In a cell below each chart, explain what you think the chart illustrates. 7. The Golf Purchases.worksheet contains percentage data for golf purchases organized by age groups and gender. The data also includes a breakout of the age and gender of the U.S. population by percentage. Create a doughnut chart and one other chart of your choice to compare the purchases by gender each year with the U.S. population. Place the two charts on the same worksheet as the source data. Include appropriate titles and a legend in each chart. In a cell below each chart, explain what you think the chart illustrates. 5. The Camping Purchases worksheet contains percentage data for camping purchases organized by age groups and gender. The data also includes a breakout of the age and gender of the U.S. population by percentage. Create an area chart, a stacked area chart, and a 100% stacked area chart to compare the purchases by different age groups each year with the U.S. population. Place the three charts on the same worksheet as the source data. Include appropriate titles and a legend in each chart. In a cell below each chart, explain what you think the chart illustrates. 6. The Fitness Purchases worksheet contains percentage data for fitness purchases organized by age groups and gender. The data also includes a breakout of the age and gender of the U.S. population by percentage. Create a line chart, a stacked line chart, and a 100% stacked line chart to compare the purchases by different age groups each year with the U.S. population. Place the three charts on the same worksheet as the source data. Include appropriate titles and a legend in each chart. In a cell below each chart, explain what you think the chart illustrates. 7. The Golf Purchases worksheet contains percentage data for golf purchases organized by age groups and gender. The data also includes a breakout of the age and gender of the U.S. population by percentage. Create a doughnut chart and one other chart of your choice to compare the purchases by gender each year with the U.S. population. Place the two charts on the same worksheet as the source data. Include appropriate titles and a legend in each chart. In a cell below each chart, explain what you think the chart illustrates. 8. Add your name and date at the end of the exercise 9. Save and close the 3-2-A-Consumer-Purchaser-YourName.xlsX workbook. Exercise Ch3-4: Level 2- Analyzing Stock Performance for Universal Investments. As an analyst at the Universal Investments financial company, you regularly monitor the performance of your clients' investments. You are preparing for a meeting with one of your investors to discuss how their stocks have performed over the last year and changes they should make to their portfolio. Your client has asked for information on four companies: Intel, AMD, Time Warner, and Wal-Mart. You will find daily stock price and volume information contained in the Invest.xlsx workbook. Complete the following: 1. Open the workbook named Invest-1.xIsx attached with the data of the assignment, and then save the file as 3-4-Investment-Performance-YourName. x Isx 2. Create a chart for each company using the appropriate stock chart sub-type. Be certain to use each chart sub-type only once. 3. Place each chart on a new sheet in the workbook. 4. On the Stock Comparison worksheet use the appropriate chart to compare the change in stock price for each company over the last year. 5. Using the information on the Portfolio worksheet, prepare the appropriate chart to display the relative contribution of each stock to the value of the portfolio. 6. Create an appropriate Combo chart on the Intel Summary worksheet that shows the daily closing price and volume data. Add a linear and a 30 day moving average trend line to the chart. 7. Add your name and date at the end of the exercise 8. Save and close the 3-4-Investment-Performance-YourName.xlsx workbook. Pie of Pie Purchases by Sport Footwar Purchases Camping Purchases Atness Purchases Colr Equipment Purchases + 18 19 20 21 22 23 24 25 26 27 28 29 30 31 32 33 34 35 36 37 38 39 40 41 42 18 19 20 21 22 23 24 25 26 27 28 29 30 31 32 33 34 35 36 37 38 39 40 41 42 


Step by Step Solution
There are 3 Steps involved in it
Step: 1

Get Instant Access to Expert-Tailored Solutions
See step-by-step solutions with expert insights and AI powered tools for academic success
Step: 2

Step: 3

Ace Your Homework with AI
Get the answers you need in no time with our AI-driven, step-by-step assistance
Get Started


