Answered step by step
Verified Expert Solution
Question
1 Approved Answer
pls show excel formula to calculate. thx. i need orange answered for #3 and 4 The table to the left includes a sample of the
pls show excel formula to calculate. thx. i need orange answered for #3 and 4 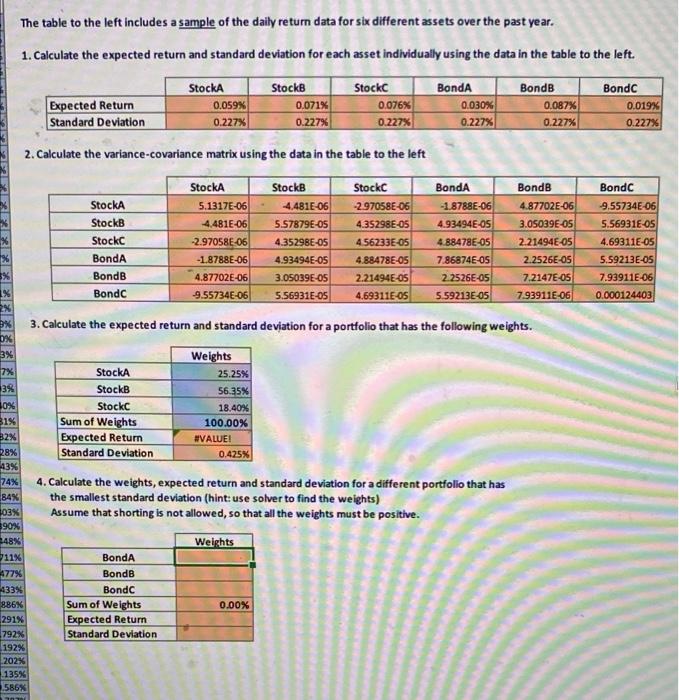
The table to the left includes a sample of the daily return data for six different assets over the past year. 1. Calculate the expected return and standard deviation for each asset individually using the data in the table to the left. StockA 0.059% 0.227% Expected Return Standard Deviation Stocks 0.071% 0.227% Stock 0.076% 0.227% BondA 0.030% BondB 0.087% 0.227% BondC 0.019% 0.227% 0.227% 2. Calculate the variance-covariance matrix using the data in the table to the left BondB StockA StockB Stock Bonda BondB Bonde Stocka 5.1317E-06 4.481E-06 -2.97058E-06 -1.8788E-06 4.87702E-06 9.55734E-06 StockB 4.481E-06 5.57879E-05 4.35298E-05 4.93494E-05 3.05039E-05 5.56931E-OS Stock -297058E-06 4.35298E-OS 4.56233E-OS 488478E-05 Bonda -1.8788E-06 4.93494E-OS 4.88478E-05 7.86874E-OS 2.2526E-05 4.87702E-06 3.05039E-OS 2.21494E-05 2.2526E-OS 7.2147E-OS 7.93911E-06 Bondc -9.55734E-06 5.56931E-05 4.69311E-05 5.59213E-OS 7.93911E-06 0.000124403 2.21494E-OS 4.69311E-OS 5.59213E-05 3. Calculate the expected return and standard deviation for a portfolio that has the following weights. OX 7% 3% 10% 31% 32% 28% 13% 74% 84% 103N 390% 348% 11% 477% 433% 886% 291% 792% 192% 202% 135% 586X Weights StockA 25.25% StockB 56.35% Stock 18.40% Sum of Weights 100.00% Expected Return #VALUE! Standard Deviation 0.425% 4. Calculate the weights, expected return and standard deviation for a different portfolio that has the smallest standard deviation (hint: use solver to find the weights) Assume that shorting is not allowed, so that all the weights must be positive. Weights Bonda BondB Bondc Sum of Weights 0.00% Expected Return Standard Deviation The table to the left includes a sample of the daily return data for six different assets over the past year. 1. Calculate the expected return and standard deviation for each asset individually using the data in the table to the left. StockA 0.059% 0.227% Expected Return Standard Deviation Stocks 0.071% 0.227% Stock 0.076% 0.227% BondA 0.030% BondB 0.087% 0.227% BondC 0.019% 0.227% 0.227% 2. Calculate the variance-covariance matrix using the data in the table to the left BondB StockA StockB Stock Bonda BondB Bonde Stocka 5.1317E-06 4.481E-06 -2.97058E-06 -1.8788E-06 4.87702E-06 9.55734E-06 StockB 4.481E-06 5.57879E-05 4.35298E-05 4.93494E-05 3.05039E-05 5.56931E-OS Stock -297058E-06 4.35298E-OS 4.56233E-OS 488478E-05 Bonda -1.8788E-06 4.93494E-OS 4.88478E-05 7.86874E-OS 2.2526E-05 4.87702E-06 3.05039E-OS 2.21494E-05 2.2526E-OS 7.2147E-OS 7.93911E-06 Bondc -9.55734E-06 5.56931E-05 4.69311E-05 5.59213E-OS 7.93911E-06 0.000124403 2.21494E-OS 4.69311E-OS 5.59213E-05 3. Calculate the expected return and standard deviation for a portfolio that has the following weights. OX 7% 3% 10% 31% 32% 28% 13% 74% 84% 103N 390% 348% 11% 477% 433% 886% 291% 792% 192% 202% 135% 586X Weights StockA 25.25% StockB 56.35% Stock 18.40% Sum of Weights 100.00% Expected Return #VALUE! Standard Deviation 0.425% 4. Calculate the weights, expected return and standard deviation for a different portfolio that has the smallest standard deviation (hint: use solver to find the weights) Assume that shorting is not allowed, so that all the weights must be positive. Weights Bonda BondB Bondc Sum of Weights 0.00% Expected Return Standard Deviation Step by Step Solution
There are 3 Steps involved in it
Step: 1

Get Instant Access to Expert-Tailored Solutions
See step-by-step solutions with expert insights and AI powered tools for academic success
Step: 2

Step: 3
Ace Your Homework with AI
Get the answers you need in no time with our AI-driven, step-by-step assistance
Get Started