

Answered step by step
Verified Expert Solution
Question
1 Approved Answer
pls show work II 12 Months Ended CASH FLOWS STATEMENTS - USD ($) $ in Millions begin{tabular}{|l|l|l|} hline Jun. 30,2022 & Jun. 30,2021 & Jun.
pls show work 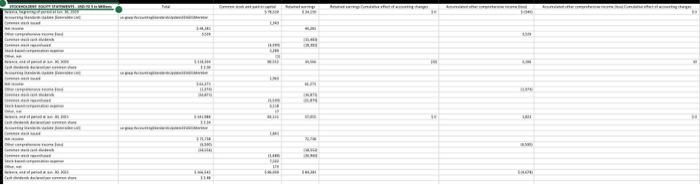
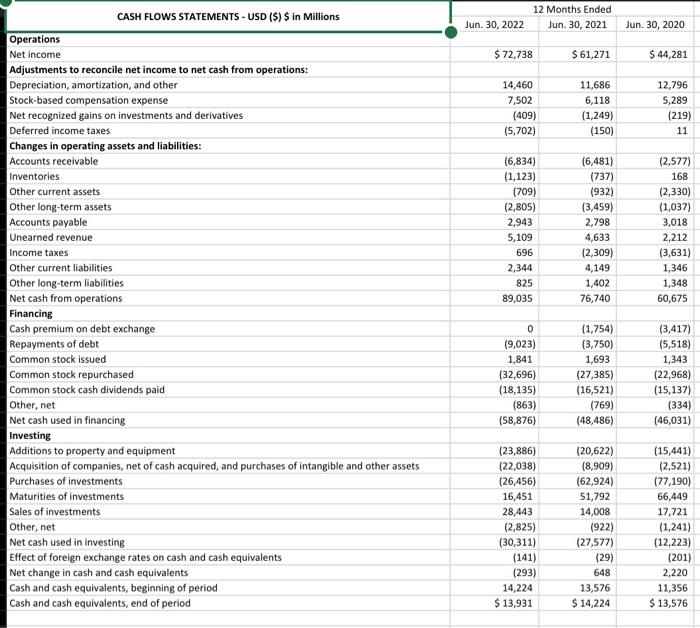
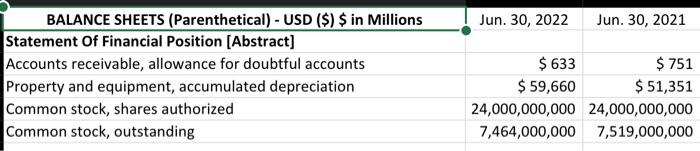
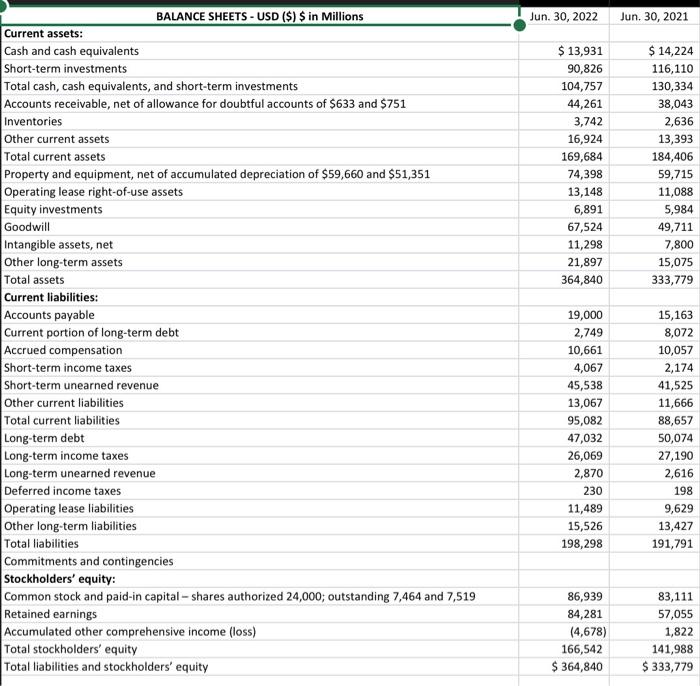
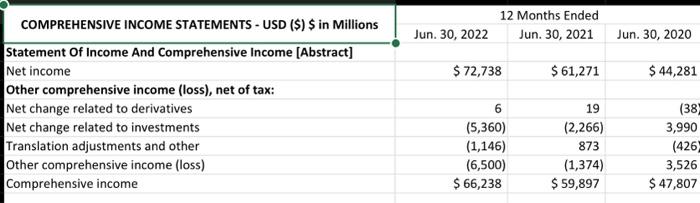
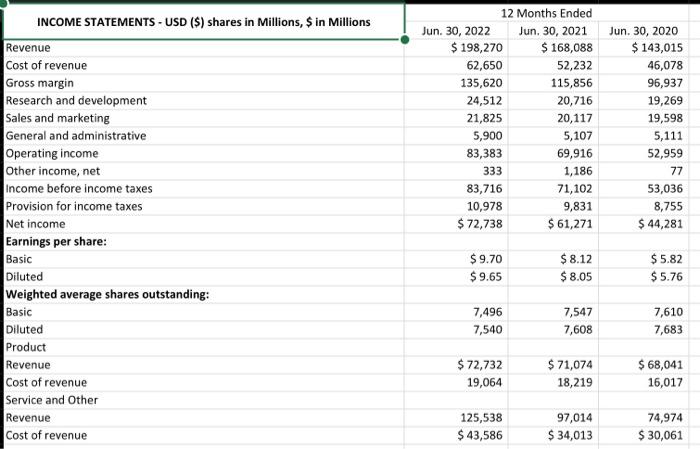
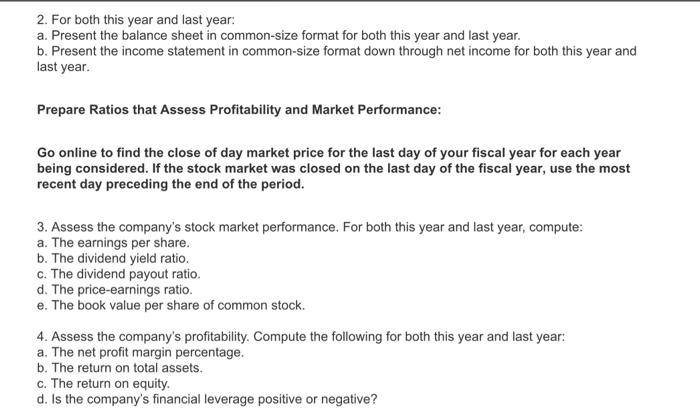
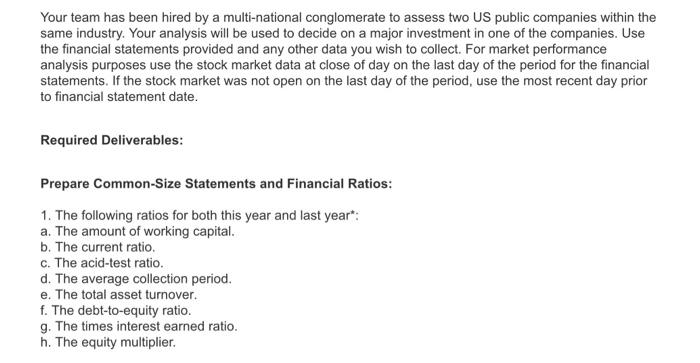
II 12 Months Ended CASH FLOWS STATEMENTS - USD (\$) \$ in Millions \begin{tabular}{|l|l|l|} \hline Jun. 30,2022 & Jun. 30,2021 & Jun. 30,2020 \\ \hline \end{tabular} Operations Net income Adjustments to reconcile net income to net cash from operations: Depreciation, amortization, and other Stock-based compensation expense Net recognized gains on investments and derivatives Deferred income taxes Changes in operating assets and liabilities: Accounts receivable Inventories Other current assets Other long-term assets Accounts payable Unearned revenue Income taxes Other current liabilities Other long-term liabilities Net cash from operations Financing Cash premium on debt exchange Repayments of debt Common stock issued Common stock repurchased Common stock cash dividends paid Other, net Net cash used in financing Investing \begin{tabular}{|l|r|r|} \hline \multicolumn{1}{|c|}{ BALANCE SHEETS (Parenthetical) - USD (\$) \$ in Millions } & Jun. 30, 2022 & Jun. 30, 2021 \\ \hline Statement Of Financial Position [Abstract] & & \\ \hline Accounts receivable, allowance for doubtful accounts & $633 & $751 \\ \hline Property and equipment, accumulated depreciation & $59,660 & $51,351 \\ \hline Common stock, shares authorized & 24,000,000,000 & 24,000,000,000 \\ \hline Common stock, outstanding & 7,464,000,000 & 7,519,000,000 \\ \hline \end{tabular} BALANCE SHEETS - USD (\$) $ in Millions Jun. 30,2022 Jun. 30,2021 Current assets: Cash and cash equivalents Short-term investments Total cash, cash equivalents, and short-term investments Accounts receivable, net of allowance for doubtful accounts of $633 and $751 Inventories Other current assets Total current assets Property and equipment, net of accumulated depreciation of $59,660 and $51,351 Operating lease right-of-use assets Equity investments Goodwill Intangible assets, net Other long-term assets Total assets \begin{tabular}{|r|r|} \hline$13,931 & $14,224 \\ \hline 90,826 & 116,110 \\ \hline 104,757 & 130,334 \\ \hline 44,261 & 38,043 \\ \hline 3,742 & 2,636 \\ \hline 16,924 & 13,393 \\ \hline 169,684 & 184,406 \\ \hline 74,398 & 59,715 \\ \hline 13,148 & 11,088 \\ \hline 6,891 & 5,984 \\ \hline 67,524 & 49,711 \\ \hline 11,298 & 7,800 \\ \hline 21,897 & 15,075 \\ \hline 364,840 & 333,779 \\ \hline \end{tabular} Current liabilities: Accounts payable Current portion of long-term debt Accrued compensation Short-term income taxes Short-term unearned revenue Other current liabilities Total current liabilities Long-term debt Long-term income taxes Long-term unearned revenue Deferred income taxes Operating lease liabilities Other long-term liabilities Total liabilities \begin{tabular}{|r|r|} \hline 19,000 & 15,163 \\ \hline 2,749 & 8,072 \\ \hline 10,661 & 10,057 \\ \hline 4,067 & 2,174 \\ \hline 45,538 & 41,525 \\ \hline 13,067 & 11,666 \\ \hline 95,082 & 88,657 \\ \hline 47,032 & 50,074 \\ \hline 26,069 & 27,190 \\ \hline 2,870 & 2,616 \\ \hline 230 & 198 \\ \hline 11,489 & 9,629 \\ \hline 15,526 & 13,427 \\ \hline 198,298 & 191,791 \\ \hline \end{tabular} Commitments and contingencies Stockholders' equity: Common stock and paid-in capital - shares authorized 24,000; outstanding 7,464 and 7,519 Retained earnings Accumulated other comprehensive income (loss) Total stockholders' equity Total liabilities and stockholders' equity 2. For both this year and last year: a. Present the balance sheet in common-size format for both this year and last year. b. Present the income statement in common-size format down through net income for both this year and last year. Prepare Ratios that Assess Profitability and Market Performance: Go online to find the close of day market price for the last day of your fiscal year for each year being considered. If the stock market was closed on the last day of the fiscal year, use the most recent day preceding the end of the period. 3. Assess the company's stock market performance. For both this year and last year, compute: a. The earnings per share. b. The dividend yield ratio. c. The dividend payout ratio. d. The price-earnings ratio. e. The book value per share of common stock. 4. Assess the company's profitability. Compute the following for both this year and last year: a. The net profit margin percentage. b. The return on total assets. c. The return on equity. d. Is the company's financial leverage positive or negative? Your team has been hired by a multi-national conglomerate to assess two US public companies within the same industry. Your analysis will be used to decide on a major investment in one of the companies. Use the financial statements provided and any other data you wish to collect. For market performance analysis purposes use the stock market data at close of day on the last day of the period for the financial statements. If the stock market was not open on the last day of the period, use the most recent day prior to financial statement date. Required Deliverables: Prepare Common-Size Statements and Financial Ratios: 1. The following ratios for both this year and last year*: a. The amount of working capital. b. The current ratio. c. The acid-test ratio. d. The average collection period. e. The total asset turnover. f. The debt-to-equity ratio. g. The times interest earned ratio. h. The equity multiplier. II 12 Months Ended CASH FLOWS STATEMENTS - USD (\$) \$ in Millions \begin{tabular}{|l|l|l|} \hline Jun. 30,2022 & Jun. 30,2021 & Jun. 30,2020 \\ \hline \end{tabular} Operations Net income Adjustments to reconcile net income to net cash from operations: Depreciation, amortization, and other Stock-based compensation expense Net recognized gains on investments and derivatives Deferred income taxes Changes in operating assets and liabilities: Accounts receivable Inventories Other current assets Other long-term assets Accounts payable Unearned revenue Income taxes Other current liabilities Other long-term liabilities Net cash from operations Financing Cash premium on debt exchange Repayments of debt Common stock issued Common stock repurchased Common stock cash dividends paid Other, net Net cash used in financing Investing \begin{tabular}{|l|r|r|} \hline \multicolumn{1}{|c|}{ BALANCE SHEETS (Parenthetical) - USD (\$) \$ in Millions } & Jun. 30, 2022 & Jun. 30, 2021 \\ \hline Statement Of Financial Position [Abstract] & & \\ \hline Accounts receivable, allowance for doubtful accounts & $633 & $751 \\ \hline Property and equipment, accumulated depreciation & $59,660 & $51,351 \\ \hline Common stock, shares authorized & 24,000,000,000 & 24,000,000,000 \\ \hline Common stock, outstanding & 7,464,000,000 & 7,519,000,000 \\ \hline \end{tabular} BALANCE SHEETS - USD (\$) $ in Millions Jun. 30,2022 Jun. 30,2021 Current assets: Cash and cash equivalents Short-term investments Total cash, cash equivalents, and short-term investments Accounts receivable, net of allowance for doubtful accounts of $633 and $751 Inventories Other current assets Total current assets Property and equipment, net of accumulated depreciation of $59,660 and $51,351 Operating lease right-of-use assets Equity investments Goodwill Intangible assets, net Other long-term assets Total assets \begin{tabular}{|r|r|} \hline$13,931 & $14,224 \\ \hline 90,826 & 116,110 \\ \hline 104,757 & 130,334 \\ \hline 44,261 & 38,043 \\ \hline 3,742 & 2,636 \\ \hline 16,924 & 13,393 \\ \hline 169,684 & 184,406 \\ \hline 74,398 & 59,715 \\ \hline 13,148 & 11,088 \\ \hline 6,891 & 5,984 \\ \hline 67,524 & 49,711 \\ \hline 11,298 & 7,800 \\ \hline 21,897 & 15,075 \\ \hline 364,840 & 333,779 \\ \hline \end{tabular} Current liabilities: Accounts payable Current portion of long-term debt Accrued compensation Short-term income taxes Short-term unearned revenue Other current liabilities Total current liabilities Long-term debt Long-term income taxes Long-term unearned revenue Deferred income taxes Operating lease liabilities Other long-term liabilities Total liabilities \begin{tabular}{|r|r|} \hline 19,000 & 15,163 \\ \hline 2,749 & 8,072 \\ \hline 10,661 & 10,057 \\ \hline 4,067 & 2,174 \\ \hline 45,538 & 41,525 \\ \hline 13,067 & 11,666 \\ \hline 95,082 & 88,657 \\ \hline 47,032 & 50,074 \\ \hline 26,069 & 27,190 \\ \hline 2,870 & 2,616 \\ \hline 230 & 198 \\ \hline 11,489 & 9,629 \\ \hline 15,526 & 13,427 \\ \hline 198,298 & 191,791 \\ \hline \end{tabular} Commitments and contingencies Stockholders' equity: Common stock and paid-in capital - shares authorized 24,000; outstanding 7,464 and 7,519 Retained earnings Accumulated other comprehensive income (loss) Total stockholders' equity Total liabilities and stockholders' equity 2. For both this year and last year: a. Present the balance sheet in common-size format for both this year and last year. b. Present the income statement in common-size format down through net income for both this year and last year. Prepare Ratios that Assess Profitability and Market Performance: Go online to find the close of day market price for the last day of your fiscal year for each year being considered. If the stock market was closed on the last day of the fiscal year, use the most recent day preceding the end of the period. 3. Assess the company's stock market performance. For both this year and last year, compute: a. The earnings per share. b. The dividend yield ratio. c. The dividend payout ratio. d. The price-earnings ratio. e. The book value per share of common stock. 4. Assess the company's profitability. Compute the following for both this year and last year: a. The net profit margin percentage. b. The return on total assets. c. The return on equity. d. Is the company's financial leverage positive or negative? Your team has been hired by a multi-national conglomerate to assess two US public companies within the same industry. Your analysis will be used to decide on a major investment in one of the companies. Use the financial statements provided and any other data you wish to collect. For market performance analysis purposes use the stock market data at close of day on the last day of the period for the financial statements. If the stock market was not open on the last day of the period, use the most recent day prior to financial statement date. Required Deliverables: Prepare Common-Size Statements and Financial Ratios: 1. The following ratios for both this year and last year*: a. The amount of working capital. b. The current ratio. c. The acid-test ratio. d. The average collection period. e. The total asset turnover. f. The debt-to-equity ratio. g. The times interest earned ratio. h. The equity multiplier Step by Step Solution
There are 3 Steps involved in it
Step: 1

Get Instant Access to Expert-Tailored Solutions
See step-by-step solutions with expert insights and AI powered tools for academic success
Step: 2

Step: 3
Ace Your Homework with AI
Get the answers you need in no time with our AI-driven, step-by-step assistance
Get Started
Uniform Administrative Requirements Cost Principles And Audit Requirements For Federal Awards A Handbook For Institutions Of Higher Education And State And Local Governments
Authors: Andrew Shepard-Smith
1st Edition
1505298482, 978-1505298482