Answered step by step
Verified Expert Solution
Question
1 Approved Answer
Pls solve with Excel The owner of Cafe Technique wants to analyze the situation of the cafe between the hours 17:00 and 22:00. It has


Pls solve with Excel
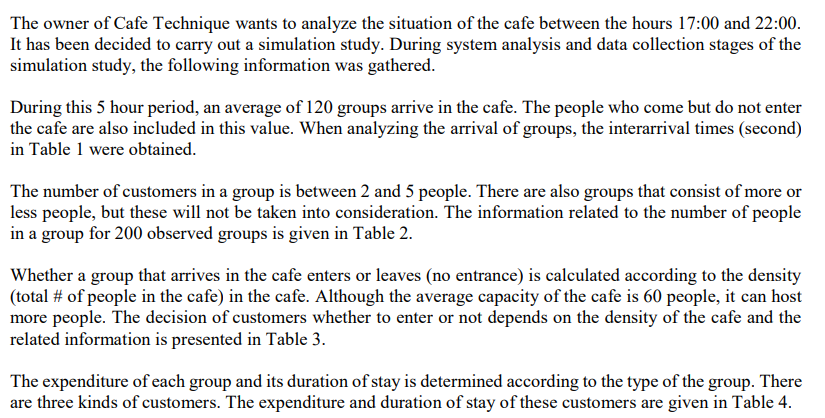
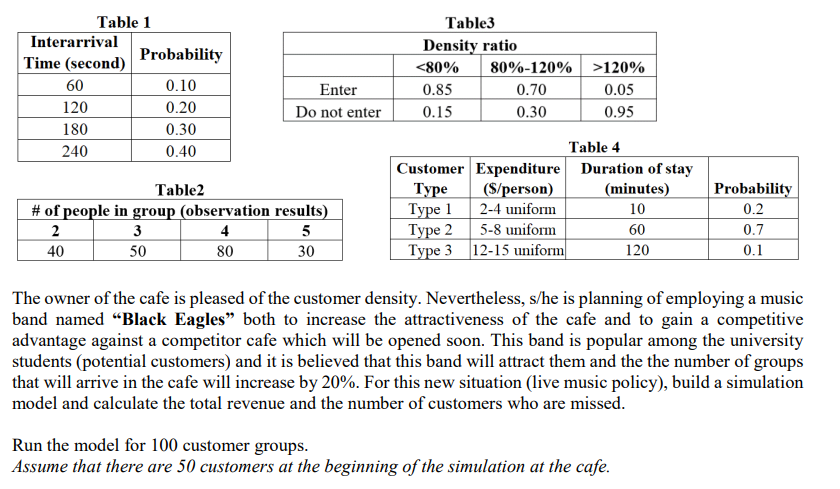
The owner of Cafe Technique wants to analyze the situation of the cafe between the hours 17:00 and 22:00. It has been decided to carry out a simulation study. During system analysis and data collection stages of the simulation study, the following information was gathered. During this 5 hour period, an average of 120 groups arrive in the cafe. The people who come but do not enter the cafe are also included in this value. When analyzing the arrival of groups, the interarrival times (second) in Table 1 were obtained. The number of customers in a group is between 2 and 5 people. There are also groups that consist of more or less people, but these will not be taken into consideration. The information related to the number of people in a group for 200 observed groups is given in Table 2. Whether a group that arrives in the cafe enters or leaves (no entrance) is calculated according to the density (total # of people in the cafe) in the cafe. Although the average capacity of the cafe is 60 people, it can host more people. The decision of customers whether to enter or not depends on the density of the cafe and the related information is presented in Table 3. The expenditure of each group and its duration of stay is determined according to the type of the group. There are three kinds of customers. The expenditure and duration of stay of these customers are given in Table 4. Table 1 Interarrival Time (second) Probability 60 0.10 120 0.20 180 0.30 240 0.40 Table3 Density ratio 120% 0.05 0.95 Table 4 Customer Expenditure Duration of stay Type ($/person) (minutes) Type 1 2-4 uniform Type 2 5-8 uniform 60 Type 3 12-15 uniform 120 Table2 # of people in group (observation results) 2 3 4 5 40 50 80 30 10 Probability 0.2 0.7 0.1 The owner of the cafe is pleased of the customer density. Nevertheless, s/he is planning of employing a music band named Black Eagles both to increase the attractiveness of the cafe and to gain a competitive advantage against a competitor cafe which will be opened soon. This band is popular among the university students (potential customers) and it is believed that this band will attract them and the the number of groups that will arrive in the cafe will increase by 20%. For this new situation (live music policy), build a simulation model and calculate the total revenue and the number of customers who are missed. Run the model for 100 customer groups. Assume that there are 50 customers at the beginning of the simulation at the cafe. The owner of Cafe Technique wants to analyze the situation of the cafe between the hours 17:00 and 22:00. It has been decided to carry out a simulation study. During system analysis and data collection stages of the simulation study, the following information was gathered. During this 5 hour period, an average of 120 groups arrive in the cafe. The people who come but do not enter the cafe are also included in this value. When analyzing the arrival of groups, the interarrival times (second) in Table 1 were obtained. The number of customers in a group is between 2 and 5 people. There are also groups that consist of more or less people, but these will not be taken into consideration. The information related to the number of people in a group for 200 observed groups is given in Table 2. Whether a group that arrives in the cafe enters or leaves (no entrance) is calculated according to the density (total # of people in the cafe) in the cafe. Although the average capacity of the cafe is 60 people, it can host more people. The decision of customers whether to enter or not depends on the density of the cafe and the related information is presented in Table 3. The expenditure of each group and its duration of stay is determined according to the type of the group. There are three kinds of customers. The expenditure and duration of stay of these customers are given in Table 4. Table 1 Interarrival Time (second) Probability 60 0.10 120 0.20 180 0.30 240 0.40 Table3 Density ratio 120% 0.05 0.95 Table 4 Customer Expenditure Duration of stay Type ($/person) (minutes) Type 1 2-4 uniform Type 2 5-8 uniform 60 Type 3 12-15 uniform 120 Table2 # of people in group (observation results) 2 3 4 5 40 50 80 30 10 Probability 0.2 0.7 0.1 The owner of the cafe is pleased of the customer density. Nevertheless, s/he is planning of employing a music band named Black Eagles both to increase the attractiveness of the cafe and to gain a competitive advantage against a competitor cafe which will be opened soon. This band is popular among the university students (potential customers) and it is believed that this band will attract them and the the number of groups that will arrive in the cafe will increase by 20%. For this new situation (live music policy), build a simulation model and calculate the total revenue and the number of customers who are missed. Run the model for 100 customer groups. Assume that there are 50 customers at the beginning of the simulation at the cafeStep by Step Solution
There are 3 Steps involved in it
Step: 1

Get Instant Access to Expert-Tailored Solutions
See step-by-step solutions with expert insights and AI powered tools for academic success
Step: 2

Step: 3

Ace Your Homework with AI
Get the answers you need in no time with our AI-driven, step-by-step assistance
Get Started


