

Answered step by step
Verified Expert Solution
Question
1 Approved Answer
pls use codes that run in Jupyter notebook Bar Bar Charts and Pie Charts His Plo Q06.30 According to the University of Waterloo, world energy
pls use codes that run in Jupyter notebook
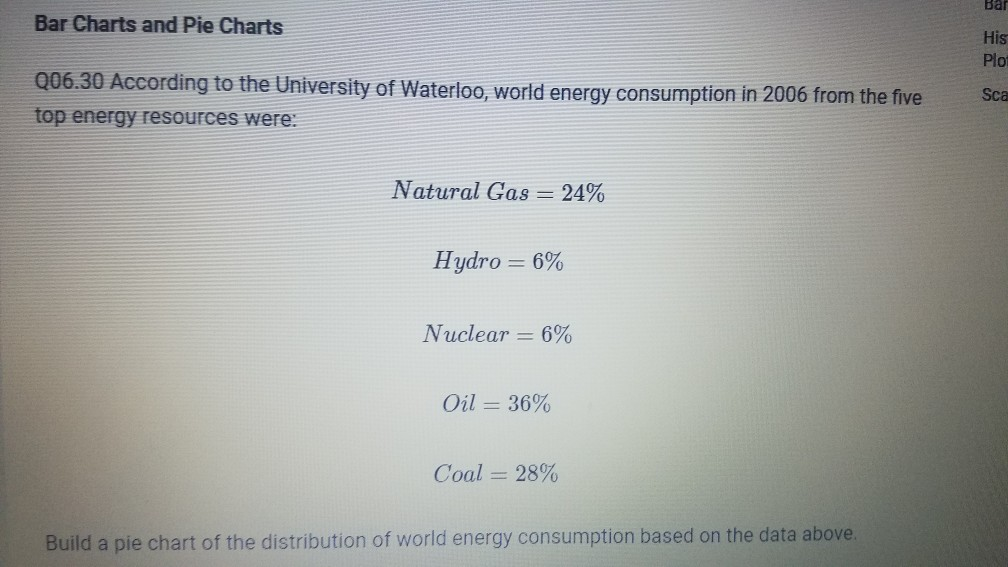
Bar Bar Charts and Pie Charts His Plo Q06.30 According to the University of Waterloo, world energy consumption in 2006 from the five top energy resources were: Sca Natural Gas = 24% Hydro = 6% Nuclear = 6% Oil = 36% Coal = 28% Build a pie chart of the distribution of world energy consumption based on the data aboveStep by Step Solution
There are 3 Steps involved in it
Step: 1

Get Instant Access to Expert-Tailored Solutions
See step-by-step solutions with expert insights and AI powered tools for academic success
Step: 2

Step: 3
Ace Your Homework with AI
Get the answers you need in no time with our AI-driven, step-by-step assistance
Get Started
Building The Data Lakehouse
Authors: Bill Inmon ,Mary Levins ,Ranjeet Srivastava
1st Edition
1634629663, 978-1634629669