plz answer only bright yellow boxes

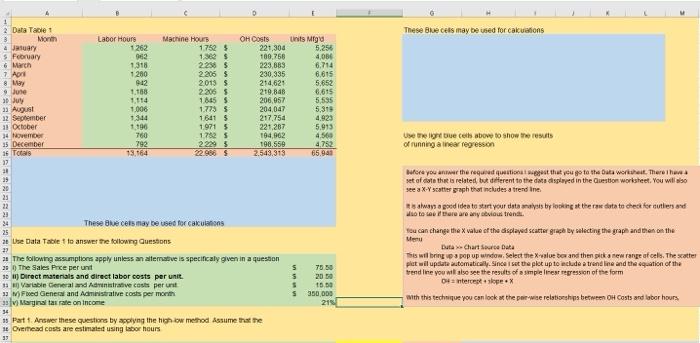
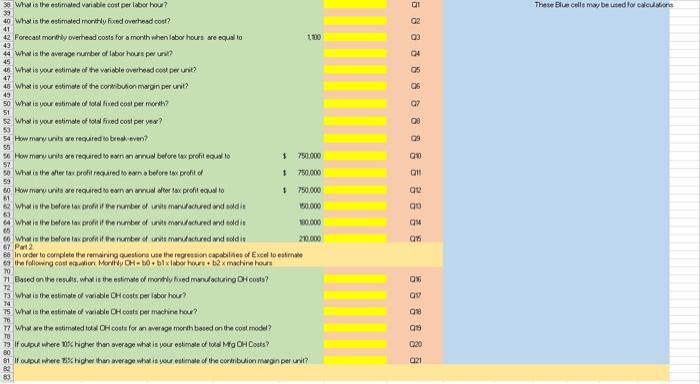
B These Blue ces may be used for caku wions Labor Hours 1 262 943 1 2 Data Table 1 3 Mont a Mary 5 Fooruary 6 March 7. April 8 May 9 June Buy 23 August 12 September 31 October 34 November 15 December 16 TONS 1318 1280 942 1150 1.114 1006 1344 1.190 760 292 13.164 Machine Hours 17525 1,362 $ 220$ 22065 2013 5 22065 10455 1.7735 1.6415 1971 5 17825 22295 OH Costs 221,300 100.766 223,883 230,935 214,621 219,848 206,057 204,047 217.750 221,287 194,962 198,559 2.543,313 Units Mga 5.256 4.000 6.714 6.615 5,652 6,615 5.535 5,319 4923 5.913 4.560 4.752 65.941 Use the groue cethabove to show the results of running a new regression 39 These are cets may be used for calculations 25 at the Data Table to answer the followig Questions 29 2. The following assumptions apply unless an attemate is specifically given in a question 25 The Sales Prce per unit 30 Direct materials and direct labor costs per unit 12 Variable General and Administrative costs per un Fred General and Administrative costs per month 38Marginstar rate on income 34 * Pat 1. Answer these questions by applying the high low method Assume that the 1 Overead costs are estimated using tabor hours 33 Bufore you answer the required quitost that you go to the Duta worth. Therehe set of Got that a related but diferent to the data displayed in the Question worksheet. You will also see a X-Yscattes graph that includes a trendine was a good idea to start your data analysis by looking at the dotato check for cuties and Mtoto here are any vious trends You can change the value of the displayed scatter grach by selecting the grape and then on the Menu Duta Chart Source Data This willing popup window. Select the X-ele bor and then ik new range af cels. The scatter pict wil uplata automatically since I set the plot up to aclude a trendline and the equation of the trendline you will also set the results of a simple linear regression of the form 04 interesse. with this technique you can look at the per-wae relationship between OH Costs and tabor hours 5 5 S 5 75 50 2050 15.50 350 000 21 01 The Blue celle may be used for colours 02 03 05 8 8 8 8 8 8 8 8 5 8 8 8 8 00 09 55 38 What is the estimated variable costerlabor hou? 40 What is the estimated monthly Fred overhead cost? 42 Forecast monthly overhead costs for a month when labor hours are equal to 100 44 What is the average number of labor hours per uni!? 46 What is your estimate of the variable overhead cost per unit? 40 What is your estimate of the contribution margin per unit? So What is your estimate the fined cost per morti? 51 What is your estimate of tot fred cost per year? 53 54 How mary units we required to break even? % How mary units are required to an annud before tax profite to $ 57 59 What is the ser tax profit required to earn a before tax profit of 750,000 60 How marwants are required to earn an errug stor tax proht equal to 1 750.000 We before tax produire rumber of the muced and addi 0.000 What is it before to profit the number of units mortured and eddie 10.000 66 What is the before to profit if the number of unite moru/actured and soldie 20.000 67 Part 2 88 in order to complete the remaining Questions use the regression capabilines of Excel to estimate the following cost cathore Money CH-10blxlabor hours machine hours 1 Bated on the results, what is the estimate of monthly find manufacturing costs? T3 What is the estimate of variable DH costs per labor hou? 15 What is the estimate of variable CH costs per machine hour? 77 What are the estimated to DH costs for an average month based on the cost model? 79 lr output where higher than average what is your estimate of tot Mg DH Cous? 81 opus where % higher than werage what is your estimate of the combuion wan perunt? 83 59 ge 0% 8 99 020 021 B These Blue ces may be used for caku wions Labor Hours 1 262 943 1 2 Data Table 1 3 Mont a Mary 5 Fooruary 6 March 7. April 8 May 9 June Buy 23 August 12 September 31 October 34 November 15 December 16 TONS 1318 1280 942 1150 1.114 1006 1344 1.190 760 292 13.164 Machine Hours 17525 1,362 $ 220$ 22065 2013 5 22065 10455 1.7735 1.6415 1971 5 17825 22295 OH Costs 221,300 100.766 223,883 230,935 214,621 219,848 206,057 204,047 217.750 221,287 194,962 198,559 2.543,313 Units Mga 5.256 4.000 6.714 6.615 5,652 6,615 5.535 5,319 4923 5.913 4.560 4.752 65.941 Use the groue cethabove to show the results of running a new regression 39 These are cets may be used for calculations 25 at the Data Table to answer the followig Questions 29 2. The following assumptions apply unless an attemate is specifically given in a question 25 The Sales Prce per unit 30 Direct materials and direct labor costs per unit 12 Variable General and Administrative costs per un Fred General and Administrative costs per month 38Marginstar rate on income 34 * Pat 1. Answer these questions by applying the high low method Assume that the 1 Overead costs are estimated using tabor hours 33 Bufore you answer the required quitost that you go to the Duta worth. Therehe set of Got that a related but diferent to the data displayed in the Question worksheet. You will also see a X-Yscattes graph that includes a trendine was a good idea to start your data analysis by looking at the dotato check for cuties and Mtoto here are any vious trends You can change the value of the displayed scatter grach by selecting the grape and then on the Menu Duta Chart Source Data This willing popup window. Select the X-ele bor and then ik new range af cels. The scatter pict wil uplata automatically since I set the plot up to aclude a trendline and the equation of the trendline you will also set the results of a simple linear regression of the form 04 interesse. with this technique you can look at the per-wae relationship between OH Costs and tabor hours 5 5 S 5 75 50 2050 15.50 350 000 21 01 The Blue celle may be used for colours 02 03 05 8 8 8 8 8 8 8 8 5 8 8 8 8 00 09 55 38 What is the estimated variable costerlabor hou? 40 What is the estimated monthly Fred overhead cost? 42 Forecast monthly overhead costs for a month when labor hours are equal to 100 44 What is the average number of labor hours per uni!? 46 What is your estimate of the variable overhead cost per unit? 40 What is your estimate of the contribution margin per unit? So What is your estimate the fined cost per morti? 51 What is your estimate of tot fred cost per year? 53 54 How mary units we required to break even? % How mary units are required to an annud before tax profite to $ 57 59 What is the ser tax profit required to earn a before tax profit of 750,000 60 How marwants are required to earn an errug stor tax proht equal to 1 750.000 We before tax produire rumber of the muced and addi 0.000 What is it before to profit the number of units mortured and eddie 10.000 66 What is the before to profit if the number of unite moru/actured and soldie 20.000 67 Part 2 88 in order to complete the remaining Questions use the regression capabilines of Excel to estimate the following cost cathore Money CH-10blxlabor hours machine hours 1 Bated on the results, what is the estimate of monthly find manufacturing costs? T3 What is the estimate of variable DH costs per labor hou? 15 What is the estimate of variable CH costs per machine hour? 77 What are the estimated to DH costs for an average month based on the cost model? 79 lr output where higher than average what is your estimate of tot Mg DH Cous? 81 opus where % higher than werage what is your estimate of the combuion wan perunt? 83 59 ge 0% 8 99 020 021


