

Answered step by step
Verified Expert Solution
Question
1 Approved Answer
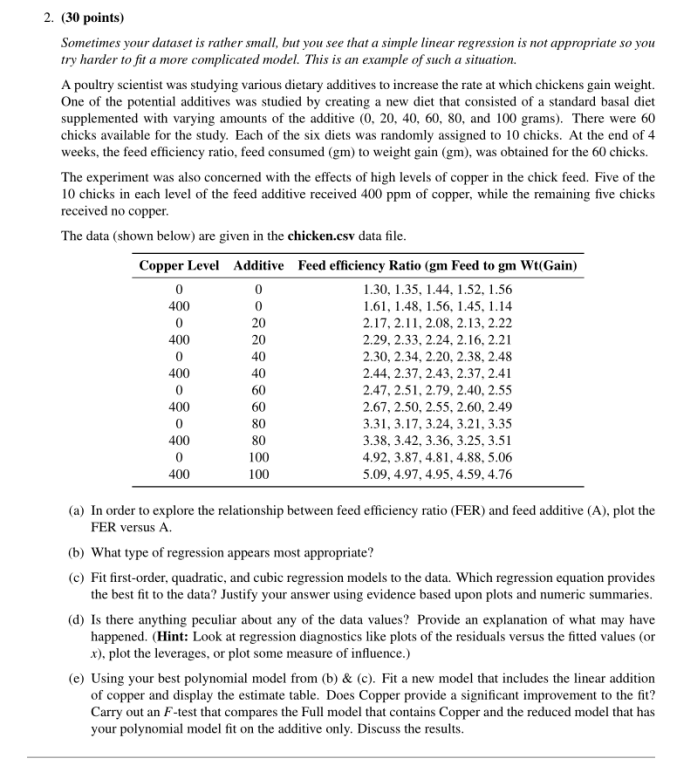
plz answer this question in R 2. (30 points) Sometimes your dataset is rather small, but you see that a simple linear regression is not
plz answer this question in R
2. (30 points) Sometimes your dataset is rather small, but you see that a simple linear regression is not appropriate so you try harder to fit a more complicated model. This is an example of s?ch a situation. A poultry scientist was studying various dietary additives to increase the rate at which chickens gain weight. One of the potential additives was studied by creating a new diet that consisted of a standard basal diet supplemented with varying amounts of the additive (0, 20, 40, 60, 80, and 100 grams). There were 60 chicks available for the study. Each of the six diets was randomly assigned to 10 chicks. At the end of 4 weeks, the feed efficiency ratio, feed consumed (gm) to weight gain (gm), was obtained for the 60 chicks. The experiment was also concerned with the effects of high levels of copper in the chick feed. Five of the 10 chicks in each level of the feed additive received 400 received no copper ppm of copper, while the remaining five chicks The data (shown below) are given in the chicken.csv data file. Copper Level Feed efficiency Ratio (gm Feed to gm Wt(Gain) 1.30, 1.35,1.44, 1.52, 1.56 1.6, 1.48,1.56, 1.45, 1.14 2.17, 2.11, 2.08, 2.13, 2.22 2.29, 2.33, 2.24. 2.16. 2.21 2.30, 2.34, 2.20, 2.38, 2.48 2.44, 2.37, 2.43, 2.37, 2.41 2.47, 2.51,2.79, 2.40, 2.55 2.67, 2.50, 2.55, 2.60, 2.49 .31, 3.17, 3.24, 3.2 3.35 3.38, 3.42, 3.36. 3.25, 3.51 4.92, 3.87,4.81, 4.88, 5.06 5.09, 4.97, 4.95, 4.59. 4.76 Additive 0 0 400 20 20 0 60 60 80 80 100 100 400 (a) In order to explore the relationship between feed efficiency ratio (FER) and feed additive (A), plot the FER versus A (b) What type of regression appears most appropriate? (c Fit first-order, quadratic, and cubic regression models to the data. Which regression equation provides the best fit to the data? Justify your answer using evidence based upon plots and numeric summaries. (d) Is there anything peculiar about any of the data values Provide an explanation of what may have happened. (Hint: Look at regression diagnostics like plots of the residuals versus the fitted values (or x), plo the leverages, or plot some measure of influence.) (e) Using your best polynomial model from (b) & (c). Fit a new model that includes the linear addition of copper and display the estimate table. Does Copper provide a significant improvement to the fit? t contains Copper and the reduced model that has Carry out an F-test that compares the Full model tha your polynomial model fit on the additive only. Discuss the results. 2. (30 points) Sometimes your dataset is rather small, but you see that a simple linear regression is not appropriate so you try harder to fit a more complicated model. This is an example of s?ch a situation. A poultry scientist was studying various dietary additives to increase the rate at which chickens gain weight. One of the potential additives was studied by creating a new diet that consisted of a standard basal diet supplemented with varying amounts of the additive (0, 20, 40, 60, 80, and 100 grams). There were 60 chicks available for the study. Each of the six diets was randomly assigned to 10 chicks. At the end of 4 weeks, the feed efficiency ratio, feed consumed (gm) to weight gain (gm), was obtained for the 60 chicks. The experiment was also concerned with the effects of high levels of copper in the chick feed. Five of the 10 chicks in each level of the feed additive received 400 received no copper ppm of copper, while the remaining five chicks The data (shown below) are given in the chicken.csv data file. Copper Level Feed efficiency Ratio (gm Feed to gm Wt(Gain) 1.30, 1.35,1.44, 1.52, 1.56 1.6, 1.48,1.56, 1.45, 1.14 2.17, 2.11, 2.08, 2.13, 2.22 2.29, 2.33, 2.24. 2.16. 2.21 2.30, 2.34, 2.20, 2.38, 2.48 2.44, 2.37, 2.43, 2.37, 2.41 2.47, 2.51,2.79, 2.40, 2.55 2.67, 2.50, 2.55, 2.60, 2.49 .31, 3.17, 3.24, 3.2 3.35 3.38, 3.42, 3.36. 3.25, 3.51 4.92, 3.87,4.81, 4.88, 5.06 5.09, 4.97, 4.95, 4.59. 4.76 Additive 0 0 400 20 20 0 60 60 80 80 100 100 400 (a) In order to explore the relationship between feed efficiency ratio (FER) and feed additive (A), plot the FER versus A (b) What type of regression appears most appropriate? (c Fit first-order, quadratic, and cubic regression models to the data. Which regression equation provides the best fit to the data? Justify your answer using evidence based upon plots and numeric summaries. (d) Is there anything peculiar about any of the data values Provide an explanation of what may have happened. (Hint: Look at regression diagnostics like plots of the residuals versus the fitted values (or x), plo the leverages, or plot some measure of influence.) (e) Using your best polynomial model from (b) & (c). Fit a new model that includes the linear addition of copper and display the estimate table. Does Copper provide a significant improvement to the fit? t contains Copper and the reduced model that has Carry out an F-test that compares the Full model tha your polynomial model fit on the additive only. Discuss the resultsStep by Step Solution
There are 3 Steps involved in it
Step: 1

Get Instant Access to Expert-Tailored Solutions
See step-by-step solutions with expert insights and AI powered tools for academic success
Step: 2

Step: 3
Ace Your Homework with AI
Get the answers you need in no time with our AI-driven, step-by-step assistance
Get Started
Handbook Of Database Security Applications And Trends
Authors: Michael Gertz, Sushil Jajodia
1st Edition
1441943056, 978-1441943057