 plz detail all questions and refer to excel table posted below
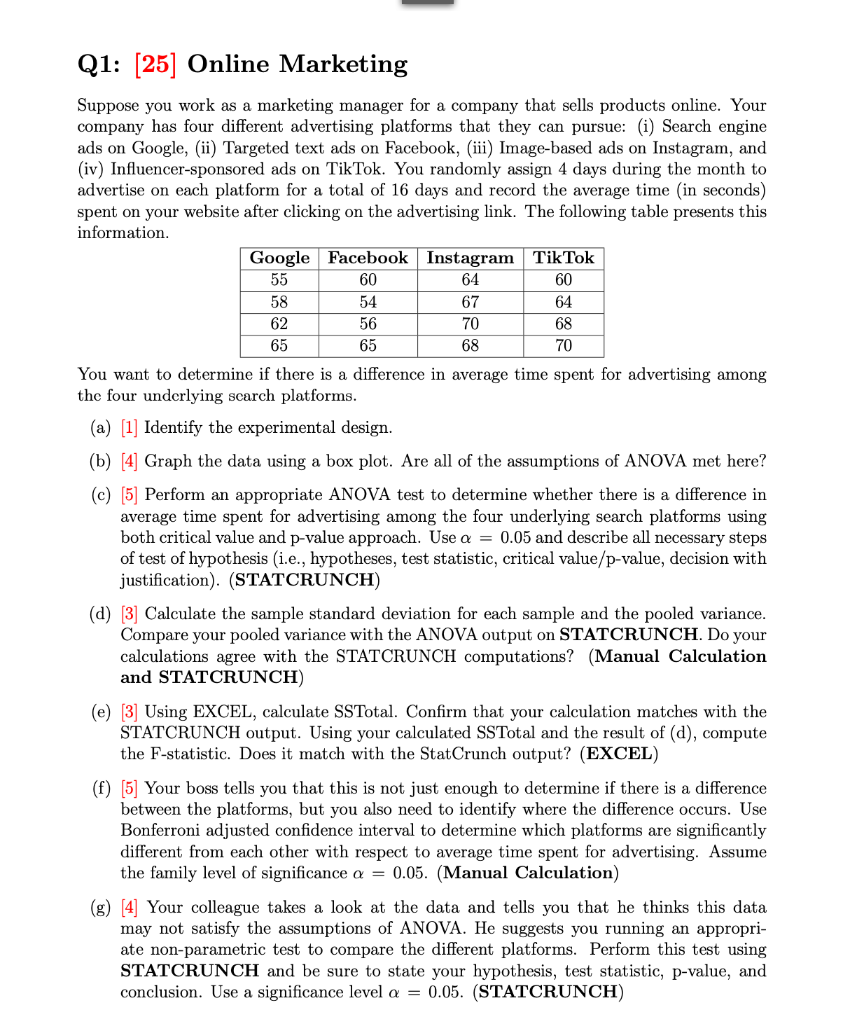
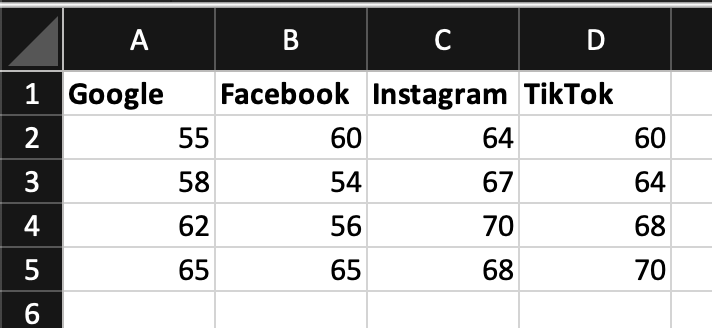
Q1: [25] Online Marketing Suppose you work as a marketing manager for a company that sells products online. Your company has four different advertising platforms that they can pursue: (i) Search engine ads on Google, (ii) Targeted text ads on Facebook, (iii) Image-based ads on Instagram, and (iv) Influencer-sponsored ads on TikTok. You randomly assign 4 days during the month to advertise on each platform for a total of 16 days and record the average time (in seconds) spent on your website after clicking on the advertising link. The following table presents this information. You want to determine if there is a difference in average time spent for advertising among the four underlying scarch platforms. (a) [1] Identify the experimental design. (b) [4] Graph the data using a box plot. Are all of the assumptions of ANOVA met here? (c) [5] Perform an appropriate ANOVA test to determine whether there is a difference in average time spent for advertising among the four underlying search platforms using both critical value and p-value approach. Use =0.05 and describe all necessary steps of test of hypothesis (i.e., hypotheses, test statistic, critical value/p-value, decision with justification). (STATCRUNCH) (d) [3] Calculate the sample standard deviation for each sample and the pooled variance. Compare your pooled variance with the ANOVA output on STATCRUNCH. Do your calculations agree with the STATCRUNCH computations? (Manual Calculation and STATCRUNCH) (e) [3] Using EXCEL, calculate SSTotal. Confirm that your calculation matches with the STATCRUNCH output. Using your calculated SSTotal and the result of (d), compute the F-statistic. Does it match with the StatCrunch output? (EXCEL) (f) [5] Your boss tells you that this is not just enough to determine if there is a difference between the platforms, but you also need to identify where the difference occurs. Use Bonferroni adjusted confidence interval to determine which platforms are significantly different from each other with respect to average time spent for advertising. Assume the family level of significance =0.05. (Manual Calculation) (g) [4] Your colleague takes a look at the data and tells you that he thinks this data may not satisfy the assumptions of ANOVA. He suggests you running an appropriate non-parametric test to compare the different platforms. Perform this test using STATCRUNCH and be sure to state your hypothesis, test statistic, p-value, and conclusion. Use a significance level =0.05. (STATCRUNCH) \begin{tabular}{|r|r|r|r|r|} \hline & \multicolumn{1}{|c|}{ A } & \multicolumn{1}{c|}{ B } & \multicolumn{1}{c|}{ C } & \multicolumn{1}{c|}{ D } \\ \hline 1 & Google & Facebook & Instagram & TikTok \\ \hline 2 & 55 & 60 & 64 & 60 \\ \hline 3 & 58 & 54 & 67 & 64 \\ \hline 4 & 62 & 56 & 70 & 68 \\ \hline 5 & 65 & 65 & 68 & 70 \\ \hline 6 & & & & \\ \hline \end{tabular} Q1: [25] Online Marketing Suppose you work as a marketing manager for a company that sells products online. Your company has four different advertising platforms that they can pursue: (i) Search engine ads on Google, (ii) Targeted text ads on Facebook, (iii) Image-based ads on Instagram, and (iv) Influencer-sponsored ads on TikTok. You randomly assign 4 days during the month to advertise on each platform for a total of 16 days and record the average time (in seconds) spent on your website after clicking on the advertising link. The following table presents this information. You want to determine if there is a difference in average time spent for advertising among the four underlying scarch platforms. (a) [1] Identify the experimental design. (b) [4] Graph the data using a box plot. Are all of the assumptions of ANOVA met here? (c) [5] Perform an appropriate ANOVA test to determine whether there is a difference in average time spent for advertising among the four underlying search platforms using both critical value and p-value approach. Use =0.05 and describe all necessary steps of test of hypothesis (i.e., hypotheses, test statistic, critical value/p-value, decision with justification). (STATCRUNCH) (d) [3] Calculate the sample standard deviation for each sample and the pooled variance. Compare your pooled variance with the ANOVA output on STATCRUNCH. Do your calculations agree with the STATCRUNCH computations? (Manual Calculation and STATCRUNCH) (e) [3] Using EXCEL, calculate SSTotal. Confirm that your calculation matches with the STATCRUNCH output. Using your calculated SSTotal and the result of (d), compute the F-statistic. Does it match with the StatCrunch output? (EXCEL) (f) [5] Your boss tells you that this is not just enough to determine if there is a difference between the platforms, but you also need to identify where the difference occurs. Use Bonferroni adjusted confidence interval to determine which platforms are significantly different from each other with respect to average time spent for advertising. Assume the family level of significance =0.05. (Manual Calculation) (g) [4] Your colleague takes a look at the data and tells you that he thinks this data may not satisfy the assumptions of ANOVA. He suggests you running an appropriate non-parametric test to compare the different platforms. Perform this test using STATCRUNCH and be sure to state your hypothesis, test statistic, p-value, and conclusion. Use a significance level =0.05. (STATCRUNCH) \begin{tabular}{|r|r|r|r|r|} \hline & \multicolumn{1}{|c|}{ A } & \multicolumn{1}{c|}{ B } & \multicolumn{1}{c|}{ C } & \multicolumn{1}{c|}{ D } \\ \hline 1 & Google & Facebook & Instagram & TikTok \\ \hline 2 & 55 & 60 & 64 & 60 \\ \hline 3 & 58 & 54 & 67 & 64 \\ \hline 4 & 62 & 56 & 70 & 68 \\ \hline 5 & 65 & 65 & 68 & 70 \\ \hline 6 & & & & \\ \hline \end{tabular}