

Question: PLZ don't help if you are not going to answer all questions 12. Which of the following is NOT an indication of an out-of-control process?
PLZ don't help if you are not going to answer all questions
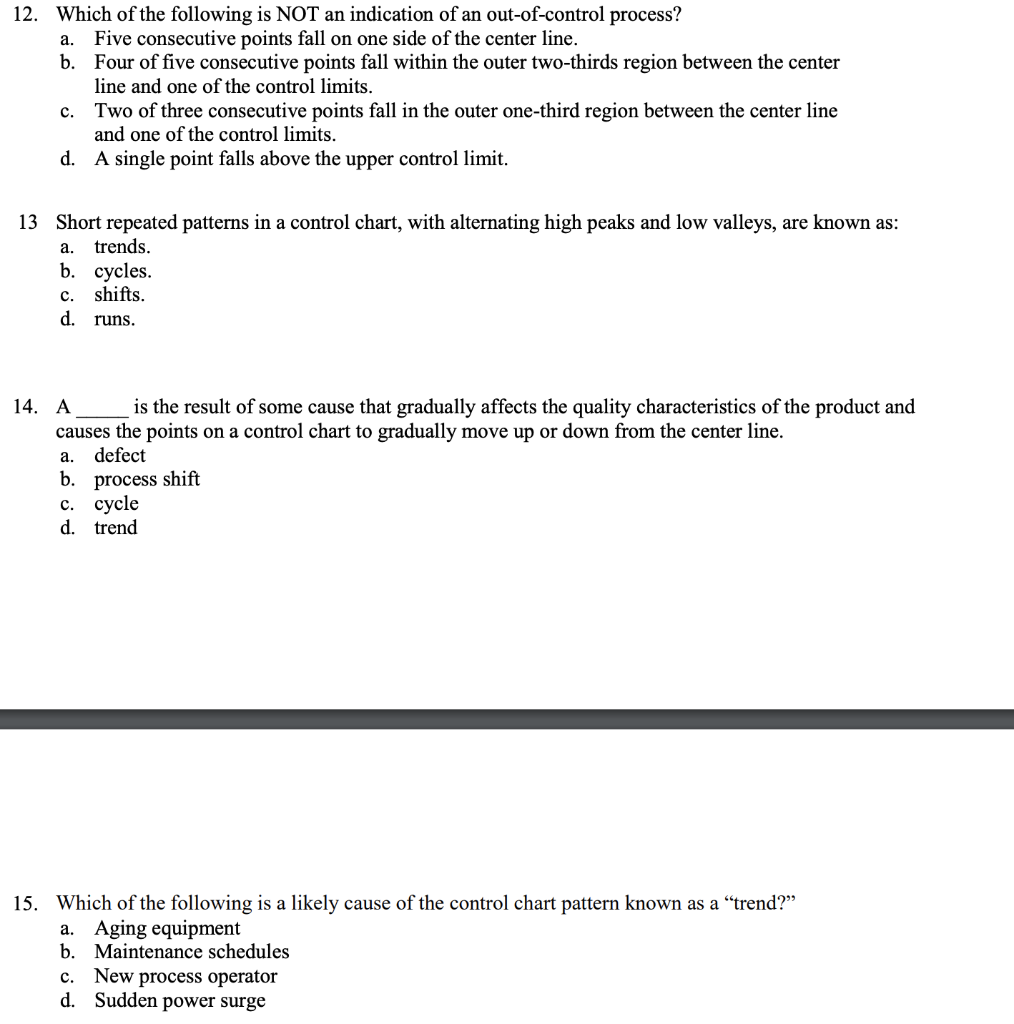
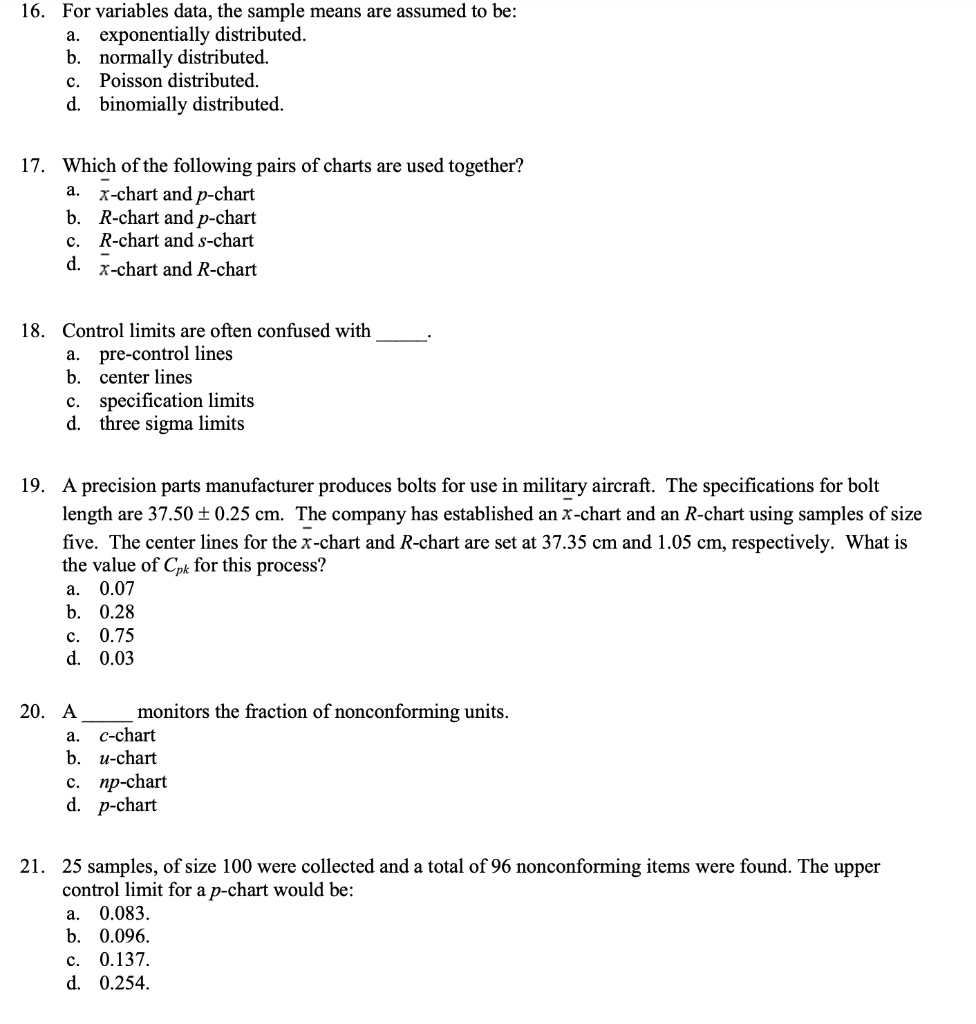
12. Which of the following is NOT an indication of an out-of-control process? a. Five consecutive points fall on one side of the center line. b. Four of five consecutive points fall within the outer two-thirds region between the center line and one of the control limits. c. Two of three consecutive points fall in the outer one-third region between the center line and one of the control limits. d. A single point falls above the upper control limit. a. 13 Short repeated patterns in a control chart, with alternating high peaks and low valleys, are known as: trends. b. cycles. c. shifts. d. runs. a. 14. A is the result of some cause that gradually affects the quality characteristics of the product and causes the points on a control chart to gradually move up or down from the center line. defect b. process shift c. cycle d. trend 15. Which of the following is a likely cause of the control chart pattern known as a trend? a. Aging equipment b. Maintenance schedules c. New process operator d. Sudden power surge 16. For variables data, the sample means are assumed to be: a. exponentially distributed. b. normally distributed. c. Poisson distributed. d. binomially distributed. 17. Which of the following pairs of charts are used together? a. X-chart and p-chart b. R-chart and p-chart c. R-chart and s-chart d. x-chart and R-chart 18. Control limits are often confused with a. pre-control lines b. center lines c. specification limits d. three sigma limits 19. A precision parts manufacturer produces bolts for use in military aircraft. The specifications for bolt length are 37.50 +0.25 cm. The company has established an X-chart and an R-chart using samples of size five. The center lines for the x-chart and R-chart are set at 37.35 cm and 1.05 cm, respectively. What is the value of Cpk for this process? a. 0.07 b. 0.28 c. 0.75 d. 0.03 20. A monitors the fraction of nonconforming units. a. C-chart b. u-chart c. np-chart d. p-chart a. 21. 25 samples, of size 100 were collected and a total of 96 nonconforming items were found. The upper control limit for a p-chart would be: 0.083. b. 0.096. c. 0.137. d. 0.254. 12. Which of the following is NOT an indication of an out-of-control process? a. Five consecutive points fall on one side of the center line. b. Four of five consecutive points fall within the outer two-thirds region between the center line and one of the control limits. c. Two of three consecutive points fall in the outer one-third region between the center line and one of the control limits. d. A single point falls above the upper control limit. a. 13 Short repeated patterns in a control chart, with alternating high peaks and low valleys, are known as: trends. b. cycles. c. shifts. d. runs. a. 14. A is the result of some cause that gradually affects the quality characteristics of the product and causes the points on a control chart to gradually move up or down from the center line. defect b. process shift c. cycle d. trend 15. Which of the following is a likely cause of the control chart pattern known as a trend? a. Aging equipment b. Maintenance schedules c. New process operator d. Sudden power surge 16. For variables data, the sample means are assumed to be: a. exponentially distributed. b. normally distributed. c. Poisson distributed. d. binomially distributed. 17. Which of the following pairs of charts are used together? a. X-chart and p-chart b. R-chart and p-chart c. R-chart and s-chart d. x-chart and R-chart 18. Control limits are often confused with a. pre-control lines b. center lines c. specification limits d. three sigma limits 19. A precision parts manufacturer produces bolts for use in military aircraft. The specifications for bolt length are 37.50 +0.25 cm. The company has established an X-chart and an R-chart using samples of size five. The center lines for the x-chart and R-chart are set at 37.35 cm and 1.05 cm, respectively. What is the value of Cpk for this process? a. 0.07 b. 0.28 c. 0.75 d. 0.03 20. A monitors the fraction of nonconforming units. a. C-chart b. u-chart c. np-chart d. p-chart a. 21. 25 samples, of size 100 were collected and a total of 96 nonconforming items were found. The upper control limit for a p-chart would be: 0.083. b. 0.096. c. 0.137. d. 0.254Step by Step Solution
There are 3 Steps involved in it
1 Expert Approved Answer
Step: 1 Unlock

Question Has Been Solved by an Expert!
Get step-by-step solutions from verified subject matter experts
Step: 2 Unlock
Step: 3 Unlock