Plz help me!
Here is the link for data: https://docs.google.com/spreadsheets/d/1y0oyFKnv7VTDCuWgPDdbvuk4AbAIn4oFZyE4Y2ZJHP0/edit?usp=sharing
The question is :
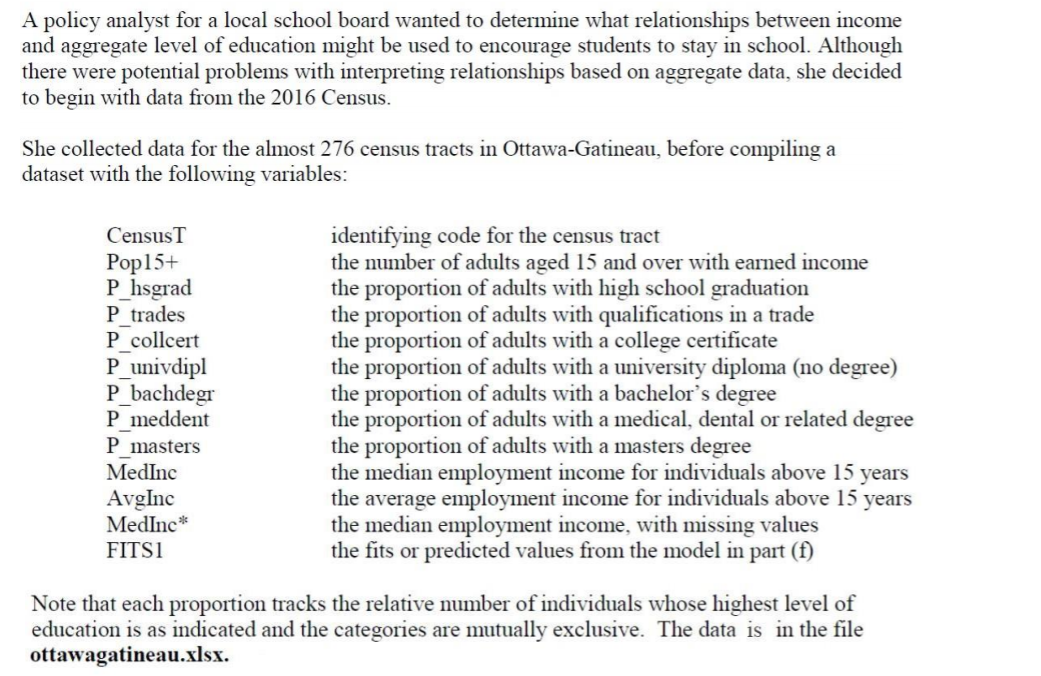
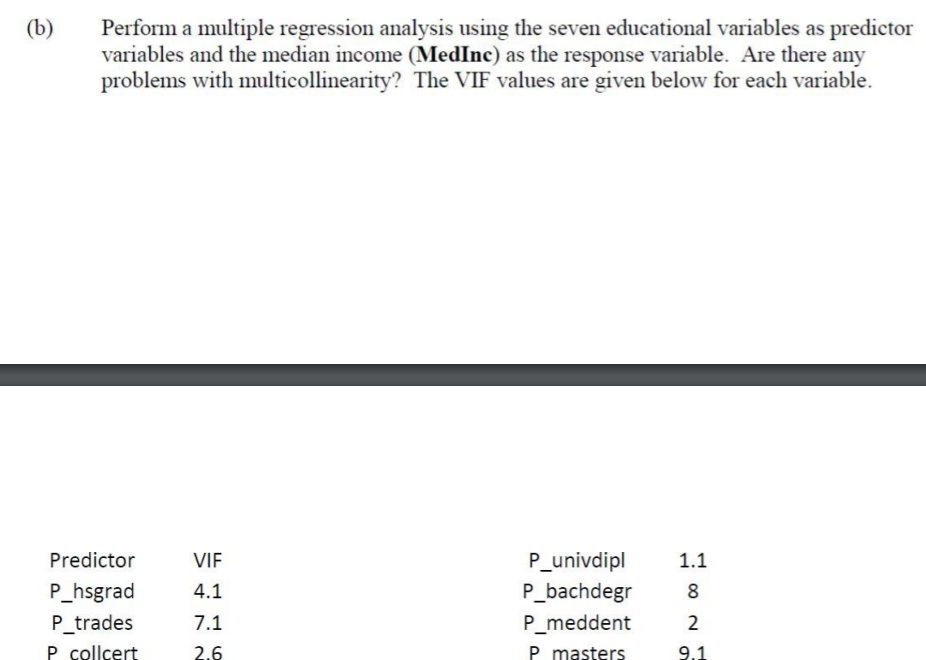
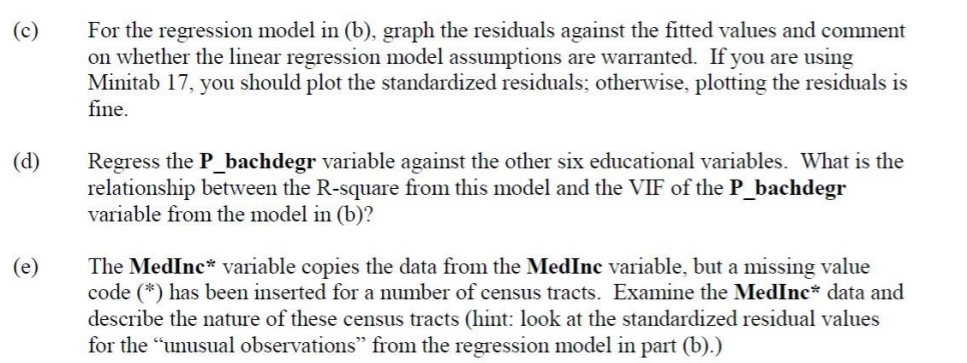
A policy analyst for a local school board wanted to determine what relationships between income and aggregate level of education might be used to encourage students to stay in school. Although there were potential problems with interpreting reiationships based on aggregate data, she decided to begin with data from the 2016 Census. She collected data for the almost 276 census tracts in Ottawa-Gatinean, before compiling a dataset with the following variables: CensusT Pop 1 5+ P_hsgrad P_trades P_collcert P_univdipl P_bachdegr P_meddent P_masters Medlnc Avglnc MedInc' FITS 1 identifying code for the census tract the number of adults aged 15 and over with earned income the proportion of adults with hi gb school graduation the proportion of adults with qualications in a trade the proportion of adults with a college certicate the proportion of adults with a university diploma (no degee) the proportion of adults with a bachelor's degree the proportion of adults with a medical, dental or related degree the proportion of adults with a masters degree the median employment income for individuals above 15 years the average employment income for individuals above 15 years the median employment income, with missing values the ts or predicted values from the model in part (i) Note that each proportion tracks the relative number of individuals whose highest level of education is as indicated and the categories are mutually exclusive. The data is in the le ottawagatineau.xlsx. (b) Perform a multiple regression analysis using the seven educational variables as predictor variables and the median income (MedInc) as the response variable. Are there any problems with multicollinearity? The VIF values are given below for each variable. Predictor VIF P_univdipl 1.1 P_hsgrad 4.1 P_bachdegr 8 P_trades 7.1 P_meddent 2 P collcert 26 P masters 91(e) (d) (e) For the regression model in (b), graph the residuals against the tted values and comment on whether the linear regression model assumptions are warranted. Ifyou are using Minitab 17, you should plot the standardized residuals; otherwise, plotting the residuals is ne. Regress the P_bachdegr variable against the other six educational variables. What is the relationship between the Rsquare from this model and the VIF of the P_bachdegr variable from the model in (b)? The MedInc" variable copies the data from the Medlnc variable, but a missing value code C\") has been inserted for a number of census tracts. Examine the Medlnc\" data and describe the nature of these census tracts (hint: look at the standardized residual values for the \"unusual observations" from the regression model in part (b).)